
Controlled capital investment
Understanding FDI mechanics and what trends in China are telling us
Robin Brooks (Senior Fellow at the Brookings Institute) recently shared an intriguing chart detailing capital investment in China across three categories from 2000 to 2023:

I enjoy analyzing economic datasets spanning long periods because economic development — especially for developing countries — is a long-term endeavor that unfolds over multiple decades. Foreign direct investment (FDI) is just one facet of economic development and I have found that it is often misunderstood because some aspects of it are not well-understood.
Years ago, I had spent time really trying to understand the accounting behind balance of payments (BoP) and trade flows. In 2019, I explored the question “Why does the US have such a high trade deficit?” by immersing myself into U.S. BoP data on the current account side. This background may provide helpful context for understanding the FDI component, which sits on the capital account side. In recent years, I have also relied heavily on the work that Brad Setser does on BoP to “stay current” on the trends; I highly recommend following him.
This post aims to educate both myself and readers about the accounting mechanics underpinning FDI flows, different archetypes of companies that impact both inbound and outbound capital investment, and how various dynamics intersect with observable trends in the news.
Accounting mechanics of capital investment in a controlled capital account
The first two categories of capital investment are fairly straightforward:
Non-resident inflows (blue) represent registered new capital from either foreign companies that are already operating in China or new ones that are looking to invest in China for the first time.
Resident outflows (red) are mainland Chinese companies that are investing outside of China.
These two categories are relatively easy to understand because they are directly linked to real foreign exchange operations that are easily trackable. China operates a controlled capital account. In practical terms, this means that whenever a foreign company seeks to exchange foreign currency for local renminbi, or when a mainland company wants to perform the reverse exchange, they must submit paperwork to their banks specifying the purpose of the exchange1.

The red and blue lines capture the transactions that are specified as “capital investment” in the foreign exchange conversion operations.
Non-resident reinvested earnings is more complicated
“Non-resident reinvested earnings” is more complicated because it involves some accounting estimation. I have found this component to be the source of much misunderstanding about Chinese FDI.
Onshore reinvested earnings is equal to profits (or losses) generated at the onshore subsidiary minus dividends that are repatriated outside of China back to the parent2.
As above with capital investment, the repatriated dividends involve currency conversion and will thus involve paperwork with the bank that is handling the foreign exchange. In this case, in its foreign exchange application the company specifies that this foreign exchange operation is to take profits as opposed to liquidation of capital investment.
The profit and loss (“P&L”) component is the more non-intuitive and problematic aspect. Anyone experienced in reading financial statements will appreciate how calculations behind accounting profits and losses are often subject to accounting rules and judgments that may not always be intuitive.
For instance, when a company liquidates an asset or ceases operations, a final calculation is necessary to reconcile or balance3 the difference between the sale or liquidation proceeds and the latest accounting value or net worth on the balance sheet. These figures can often be very different, especially if it has been running an unsuccessful loss-making operation in a business with significant capital investment. This can lead to large realized “one-time” losses. Conversely, if you built a successful operation and decided to sell the business for a large profit, it can realize a very large “one-time” accounting profit when you sell the business.
Even after excluding one-time “extraordinary” profits and losses, another complicating factor with “non-resident reinvested earnings” arises from potential timing mismatches. When a company generates profit, it faces two choices:
Return the profit to the capital holders as a return on capital via dividends.
Reinvest the profits back into the business, presumably to foster growth at an attractive rate of return.
These two choices can be driven by different decision-making dynamics. Some companies with currently profitable operations but dim future growth prospects may opt to extract profits from the operation (via repatriated dividends) rather than incrementally investing in it. In this scenario, they would not significantly contribute to the yellow “reinvested earnings” line. Others may see strong growth prospects for their products or services and choose to reinvest all profits back into the onshore operation. This would contribute to “reinvested earnings” FDI.
Additionally, some companies may perceive growth prospects as so high that they seek to invest beyond what the onshore operation can self-fund. In such cases, they would rely on new capital investment from the offshore parent company, which would undergo the same foreign currency process described earlier. The incremental amount would then be counted as new FDI (blue line).
Conversely, companies that are loss-making have no earnings to reinvest. If they do take distributions from the business, it would be drawn from historical reinvested earnings accumulated during profitable periods when they opted to retain profits within the onshore operation (e.g., as working capital). In such instances, reinvested earnings would be negative. This underscores how mismatched timing also influences reinvested earnings data. A company might generate accounting profits in Year 1, but these profits require time to convert to cash that can be repatriated, only becoming available as dividends in Year 2.
Furthermore, it’s important to note that just because foreign exchange operations are documented, it does not always ensure accuracy. Companies can misclassify foreign exchange operations between “dividends” and “capital,” either inadvertently due to negligence or intentionally to disguise their transactions — tax avoidance being a significant motive. Some FDI is registered to foreign-domiciled companies may effectively be Chinese4 that are again either inadvertently or intentionally miscategorizing the flows in their foreign exchange applications.
Additional complications with “reinvested earnings”
There are additional complications involved in the actual calculation of “reinvested earnings”. As Homin Lee notes here, “in 2013, China stopped providing data on the portion of FDI inflows attributable to reinvested earnings.” The methodology underpinning Robin’s “reinvested earnings” flow data is derived from the difference between two different sets of flow data from two different organizations (SAFE vs. Ministry of Commerce or “MOFCOM”). The MOFCOM data shows only new and incremental registered FDI flows that correspond to “non-resident inflows (actually utilized)” in Robin’s dataset while the difference between SAFE and MOFCOM correspond to the “non-resident reinvested earnings”:
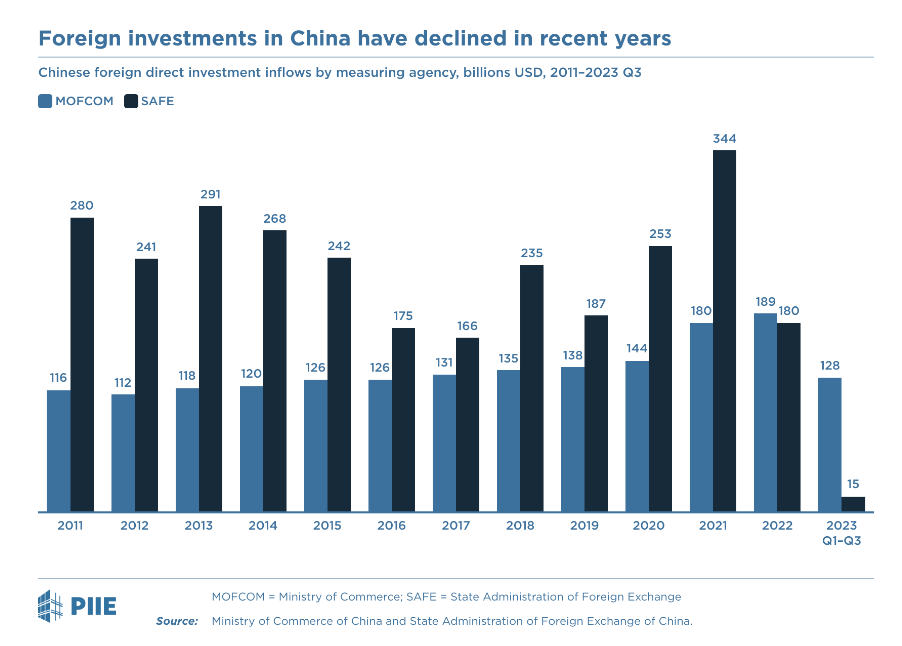
There are some differences in what is included in the definition of FDI between the SAFE and MOFCOM datasets5, although as Nicholas Lardy notes here in this report, these differences are “now likely quite small”. This follow-up from Robin also shows high correlation between the data that underpins the SAFE and MOFCOM datasets6.
Understanding these mundane mechanics of accounting are important as we try to parse through and interpret the data.
Four archetypes of private sector companies
Four main archetypes of private sector companies contribute to or impact FDI in China7. They operate in a variety of sectors. Understanding these archetypes is crucial for grasping the diverse factors behind inbound and outbound capital investment in the country.
Foreign-funded export-processing companies: These companies primarily target developed markets, focusing on manufacturing goods for export, typically for more labor-intensive operations.
Foreign MNCs: Multinational corporations invest in China with the aim of penetrating its domestic market, seeking opportunities to sell their products and services to Chinese consumers.
Private real estate developers: In recent years, private real estate developers have raised large sums of capital overseas to support their expansion onshore.
Domestic firms: This archetype encompasses private sector manufacturing firms based in mainland China8. These companies serve both domestic consumers and foreign ones via exports.
1. Foreign-funded export-processing companies
Many export-processing companies relocated their factories to China in the 1990s to capitalize on the mainland’s abundant labor force. Hong Kong and Taiwanese exporters, in particular, represent a significant portion of this category. Leveraging existing connections to developed markets and expertise in managing labor-intensive manufacturing operations, these firms focused on sectors such as toys, shoes, clothing, household appliances, and consumer electronics — goods requiring substantial labor input.
Terms like “offshoring” or the “China Shock” in the 1990s and early 2000s often referred to this phenomenon. Notable examples include Belle (shoes), VTech (phones, toys), Allan (small kitchen appliances), and numerous small, often family-run factories producing non-branded goods.

Many foreign-funded exporters struggled to penetrate China’s domestic market because their products did not meet stringent price points of price-conscious Chinese consumers, along with challenges in navigating local distribution networks.
Despite these obstacles, export-processing companies experienced rapid growth through the mid-2000s, considered their “golden age.” However, the global financial crisis of 2007-08 marked the end of this prosperous era.
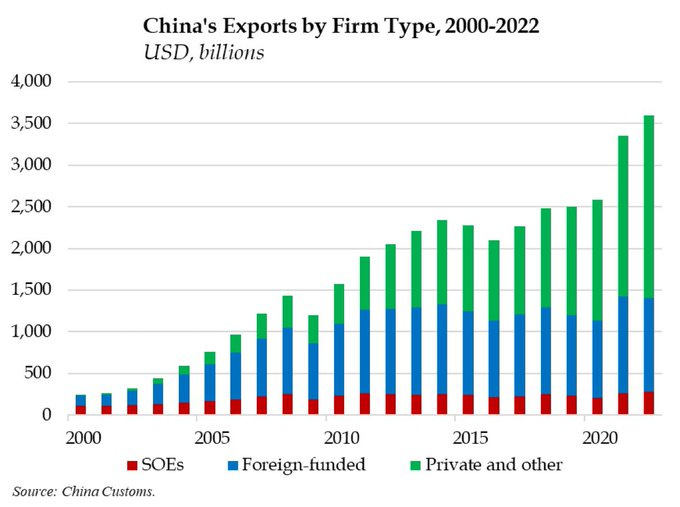
Rather than disappearing entirely, export-processing companies adapted to the changing landscape. Many invested in “semi-automation” and relocated factories further inland to access lower labor costs. While these adjustments helped initially, relentless increases in Chinese labor (and other) costs and limitations in automation9 within these industries posed ongoing challenges. Additionally, mainland firms became increasingly competitive for both labor and export markets10. The evolution of foreign-funded export processing firms can be observed in the blue bars of Gerard DiPippo's insightful chart:
In 2020-21, there was a noticeable COVID-induced bump in export activity, but these effects have since faded. With the ongoing trade war and continuously rising labor costs in China, there is an increasing trend of foreign-owned exporters relocating labor-intensive processing operations to regions like Southeast Asia and India.
Many are simply shutting down or transitioning into real estate ventures, as the next-generation family members are often unwilling or incapable of managing these struggling, often “gritty” operations.
2. Foreign MNCs
Notably, there is minimal representation by American companies in the export-processing group. Instead, this category primarily comprised larger multinational corporations (MNCs) seeking to tap into China’s vast domestic market.
A prime example is the automobile joint venture (JV) model, where foreign MNCs like GM, Toyota, or Volkswagen partner with local manufacturers such as SAIC, Dongfeng, and/or FAW to distribute their cars11 in the Chinese market. In this arrangement, the foreign MNC contributes technology, designs, branding, and consultancy expertise, while the local partner manages day-to-day operations, including hiring the local workforce, supply chain logistics, and manufacturing operations. Typically, these JVs operate on a 50/50 basis, with joint decision-making and profit-sharing.

Compared to foreign-funded export-processing companies, these ventures are much more capital-intensive, involving large-scale assembly lines with automation and robotics, complex supply chains, and substantial inventories. Whether driven by policy objectives such as “market access for technology” (市场换技术) or purely economic considerations, it was often a prerequisite for MNCs to establish manufacturing operations in China to effectively cater to Chinese consumers. Unlike export-processing companies, these ventures required Chinese partners with a deep understanding of local operations, consumer preferences, and distribution channels. Most of these ventures exclusively targeted the Chinese market and did not consider using China as an export base, often due to restrictions outlined in their JV agreements.
3. Real estate and financial services
At its peak, the property sector and financial services industry accounted for almost a third of FDI12. But since the “housing is for living, not speculation” was announced in 2016 (signaling the peak of the real estate market), foreign investment (including Chinese private developers that have been raising money overseas) in the real estate and financial services industry has been declining and only accounted for 11% of FDI in 2022.

4. Domestic firms
In the backdrop are domestic private sector manufacturers and OEMs, competing with both foreign-funded export-processing companies and foreign MNCs. In Robin’s original chart, they are represented within the red bars of outbound Chinese investment. Gerard’s chart depicts them in the green “Private and Other” line item.
These include companies like Huawei (tech/telecom), BYD (batteries/EVs/contract manufacturing), Longi (solar PV), and CATL (batteries). Launched mostly in the last three decades, they have been steadily catching up to both foreign-funded export-processing companies and foreign MNCs. The green line on Gerard’s chart reflects their progress, surpassing foreign-funded exporters around 2017-18. They have also outpaced foreign MNCs in sectors like automobiles, particularly in electric vehicles, in recent years.
What FDI trends tell us about the Chinese economy
With this crucial background in mind, let’s delve into the more intriguing part of the discussion: what do these numbers tell us?
Last October, the FT published a chart illustrating how FDI in China has reached a two-decade low. Notably, this chart was based on the SAFE FDI dataset, which includes “non-resident reinvested earnings”. I post it here alongside Robin’s chart, where the black line on the right corresponds to the dark blue monthly trends on the left:

As I pointed out in a Twitter/X thread previously, one issue with the FT chart its aggregation of new incremental FDI with the more complex “reinvested earnings” component. Robin’s chart is valuable because it disaggregates FDI into two distinct components, providing deeper insight into underlying dynamics, especially considered in the context of FDI accounting mechanics and the various company archetypes impacting capital investment decisions
Non-resident inflows
Non-resident inflows primarily comprise FDI from the two foreign-funded archetypes: export-processing companies and MNCs. This figure has remained relatively stable, steadily increasing since the early 2000s until experiencing a spike in 2021-22. While the topline numbers have been very steady, the contribution from industries has fluctuated over time13. Last year marked the first time it had declined and it will be interesting to see whether this is the beginning of a new trend.
These inflows are fairly reliable because they can be cross-checked and validated with external data from large publicly listed foreign MNCs14.
Non-resident reinvested earnings
Non-resident reinvested earnings exhibit greater volatility compared to inflows as they depend on both profitability and incremental reinvestment decisions.
Following the Global Financial Crisis (GFC), export-processing companies transitioned into being “cash cows” in contrast to growing companies requiring significant capacity expansion in the 1990s and 2000s. Consequently, a larger portion of their FDI stemmed from decisions to reinvest profits generated onshore rather than from incremental new investments. These reinvestment decisions fluctuated with the shifts in their export markets.
In contrast, foreign MNCs experienced significant growth in their China domestic sales throughout the 2010s. This growth is evident in the 10-Ks and annual reports across various industries, including smartphones (Apple), cars (GM, Toyota), planes (Boeing, Airbus), brands (Nike, Hermes), fast-food restaurants (McDonald’s), and coffee shops (Starbucks). This growth led to both increased profits and reinvestment of those profits back into their onshore operations.
Although it is challenging to precisely delineate the proportions of profits versus dividends and reinvested earnings from this dataset, we can infer trends that are becoming increasingly apparent.
However, things started to shift in 2022. Foreign MNCs are now experiencing lower profitability and are scaling back reinvestment of these reduced earnings into their businesses. Why?
Domestic Chinese firms are catching up to Foreign MNCs in certain sectors
The primary reason appears to stem from catch-up by Chinese firms. As mentioned earlier, by the mid-2010s, they had already reached parity with foreign-funded exporters. By the late 2010s, domestic Chinese firms had more or less caught up to foreign MNCs and companies in areas such as cars, smartphones, and even coffee, within the Chinese domestic market.
This trend is particularly evident in the transition from internal combustion engine (ICE) vehicles to electric vehicles (EVs). The emergence of Chinese new energy vehicle (NEV) brands has led to a sharp decline in ICE sales15, traditionally dominated by foreign MNCs through their joint ventures (JVs). For instance, as recently as 2017, GM’s equity earnings in China were contributing the majority of its global net income. However, China sales have plummeted since 2018. The realization that their products were no longer competitive came abruptly and recently.
Some automakers continued to anticipate significant market expansion until the onset of the global pandemic. Over the last five years, not only have these growth plans been shelved, but many foreign automakers — especially the smaller, weaker ones — have been compelled to shutter their China operations.

Japanese automaker Mitsubishi presents an illustrative case study here. For decades, it was a minor exporter of its branded cars to China but in 2012 it invested in a formal JV with GAC (Guangzhou Automobile Group16) to manufacture locally. Sales steadily increased from ~45k in 2013 to a peak of ~158k vehicles in 2019 before suddenly halving in 2020.
While company executives could attribute this to the pandemic, deciding to continue to invest new models until 2022, it became increasingly clear that this was a secular (not cyclical) shift in Chinese consumer preferences17. In October 2023, the business announced that it had terminated its China operations, transferring its 50% ownership to GAC and incurring a JPY24.3 billion ($162 million) one-time loss related to the restructuring. GAC would re-purpose the existing factory for the new electric vehicles that it has developed under the Aion brand. Sales of its Aion brand (launched in 2019) were now running at ~480k per year.
The realized losses incurred from the restructuring of Mitsubishi’s China operations would be recorded as a realized loss and count as negative reinvested earnings in Robin’s chart above. The shift to electric vehicles and the rapid evolution of Chinese car-buying habits have also affected numerous other foreign automotive JVs, particularly smaller brands similar to Mitsubishi. Consequently, there has been a significant decline in reinvested earnings (yellow line) since 2021, as profits have turned into losses, prompting foreign MNCs to shut down operations and withdraw any accumulated reinvested earnings from previous periods, if any.
As we can see from the non-resident inflows (blue line), not all foreign companies are struggling quite as much as the foreign auto JVs in China:
Hermes recently announced quarterly sales rising 17% on “strong China demand”, a possible indicator that “mass affluent” Chinese consumers may finally be opening their pocketbooks again.
Sales to China made up a record 49% of Dutch SME provider ASML’s revenue in Q1 despite18 export controls.
That said, even non-resident inflows experienced a decline in 2023, potentially signaling more challenges ahead. Even companies that were previously thriving in China are now encountering challenges. After years of growth Apple and Tesla have recently witnessed declining sales in China, while Starbucks recently reported decreasing same-store sales. Much of this can be attributed to the rise of Chinese competition.
Export-processing companies are moving manufacturing operations offshore at an accelerating rate
Another significant factor contributing to the decline in FDI, including both reinvested earnings and new inflows, is the trend of exporters relocating their manufacturing operations offshore. This shift is driven by rising labor costs and the imposition of bilateral Section 301 tariffs by the United States in 2018. Consequently, both foreign-funded and mainland exporters are moving their operations out of China to regions with lower labor costs, such as Southeast Asia and India.
Export processing companies, particularly those funded by Hong Kong owners, have increasingly been relocating their operations to Southeast Asia. One example is VTech, a Hong Kong-based exporter that acquired a factory in Malaysia in 2018 from Japanese consumer electronics brand Pioneer to expand its audio equipment and contract manufacturing business. Additionally, foreign brands such as Apple, through their contract manufacturers, have been transitioning manufacturing operations to Southeast Asia and other regions like India.
Since the Global Financial Crisis (GFC), foreign exporters have faced mounting challenges in China, primarily due to escalating labor costs. Samsung was early to recognize this and and initiated relocation of its manufacturing operations out of China, mainly to Vietnam, long before the imposition of the 2018 tariffs. Before the tariffs, export processing companies often deliberated whether to relocate their operations further inland or offshore. However, following the imposition of tariffs, these decisions have become increasingly clear.
It’s crucial to emphasize that the impact thus far has primarily affected export processing industries. China’s growing domestic demand is increasingly bolstering onshore manufacturing, even in sectors requiring higher labor outputs. Moreover, policymakers appear to be making concerted efforts to retain a critical mass of most manufacturing industries, aiming for a “complete supply chain”. Mainland exporters continue to manufacture in China for the domestic market while supplementing with offshore manufacturing targeted at export markets. In contrast, foreign-funded export-processing companies that did not cater to the mainland market are either relocating entirely or ceasing operations.
Real estate developers went bust
While underlying real estate construction economy had plateaued by the mid-2010s, property developers continued to sell apartments on an increasingly forward basis through aggressive pre-sales programs. This allowed them to continue booking financial profits and accumulating retained earnings. However, with the introduction of “Three Red Lines” in 2020, which essentially cut off financing and liquidity, this approach came to an end.
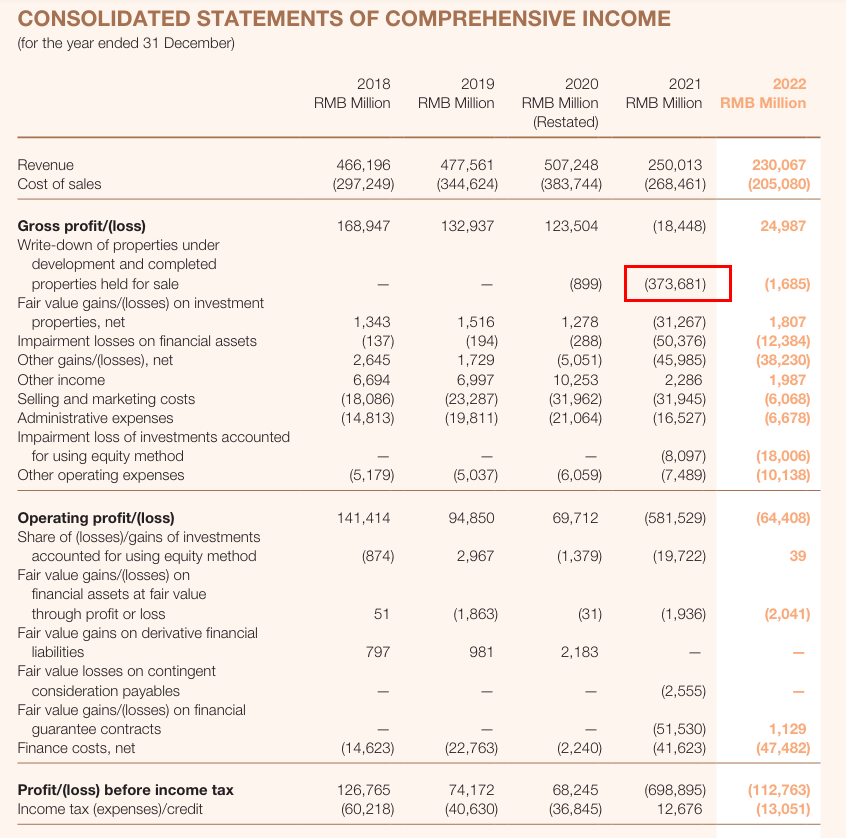
Evergrande, probably the most aggressive large developer, began revealing financial difficulties in 2021, announcing a massive write-down of assets on its balance sheet of ¥374 billion, representing over 100% of its shareholders’ equity19. Evergrande had also raised significant funds overseas, most of which was repatriated onshore to support domestic property development activities and would be counted as FDI even though it is a Chinese company.
Other developers, many of whom had also raised overseas debt, were soon to follow. These large write-downs have also likely contributed to the sharp decline in the “reinvested earnings” component of FDI in since 2021.
Macroeconomic factors impacting treasury management
Gerard DiPippo also highlights another important factor that has an impact on the estimated “reinvested earnings” figure. Companies that operate in multiple jurisdictions will have bank accounts and hold cash and liquid assets in multiple currencies. This exposes them to foreign exchange rate risk and interest rate differences. In this interesting chart, he notes the correlation between “reinvested earnings” flows and “portfolio inflows debt” flows (which are heavily impacted by interest rate differentials):
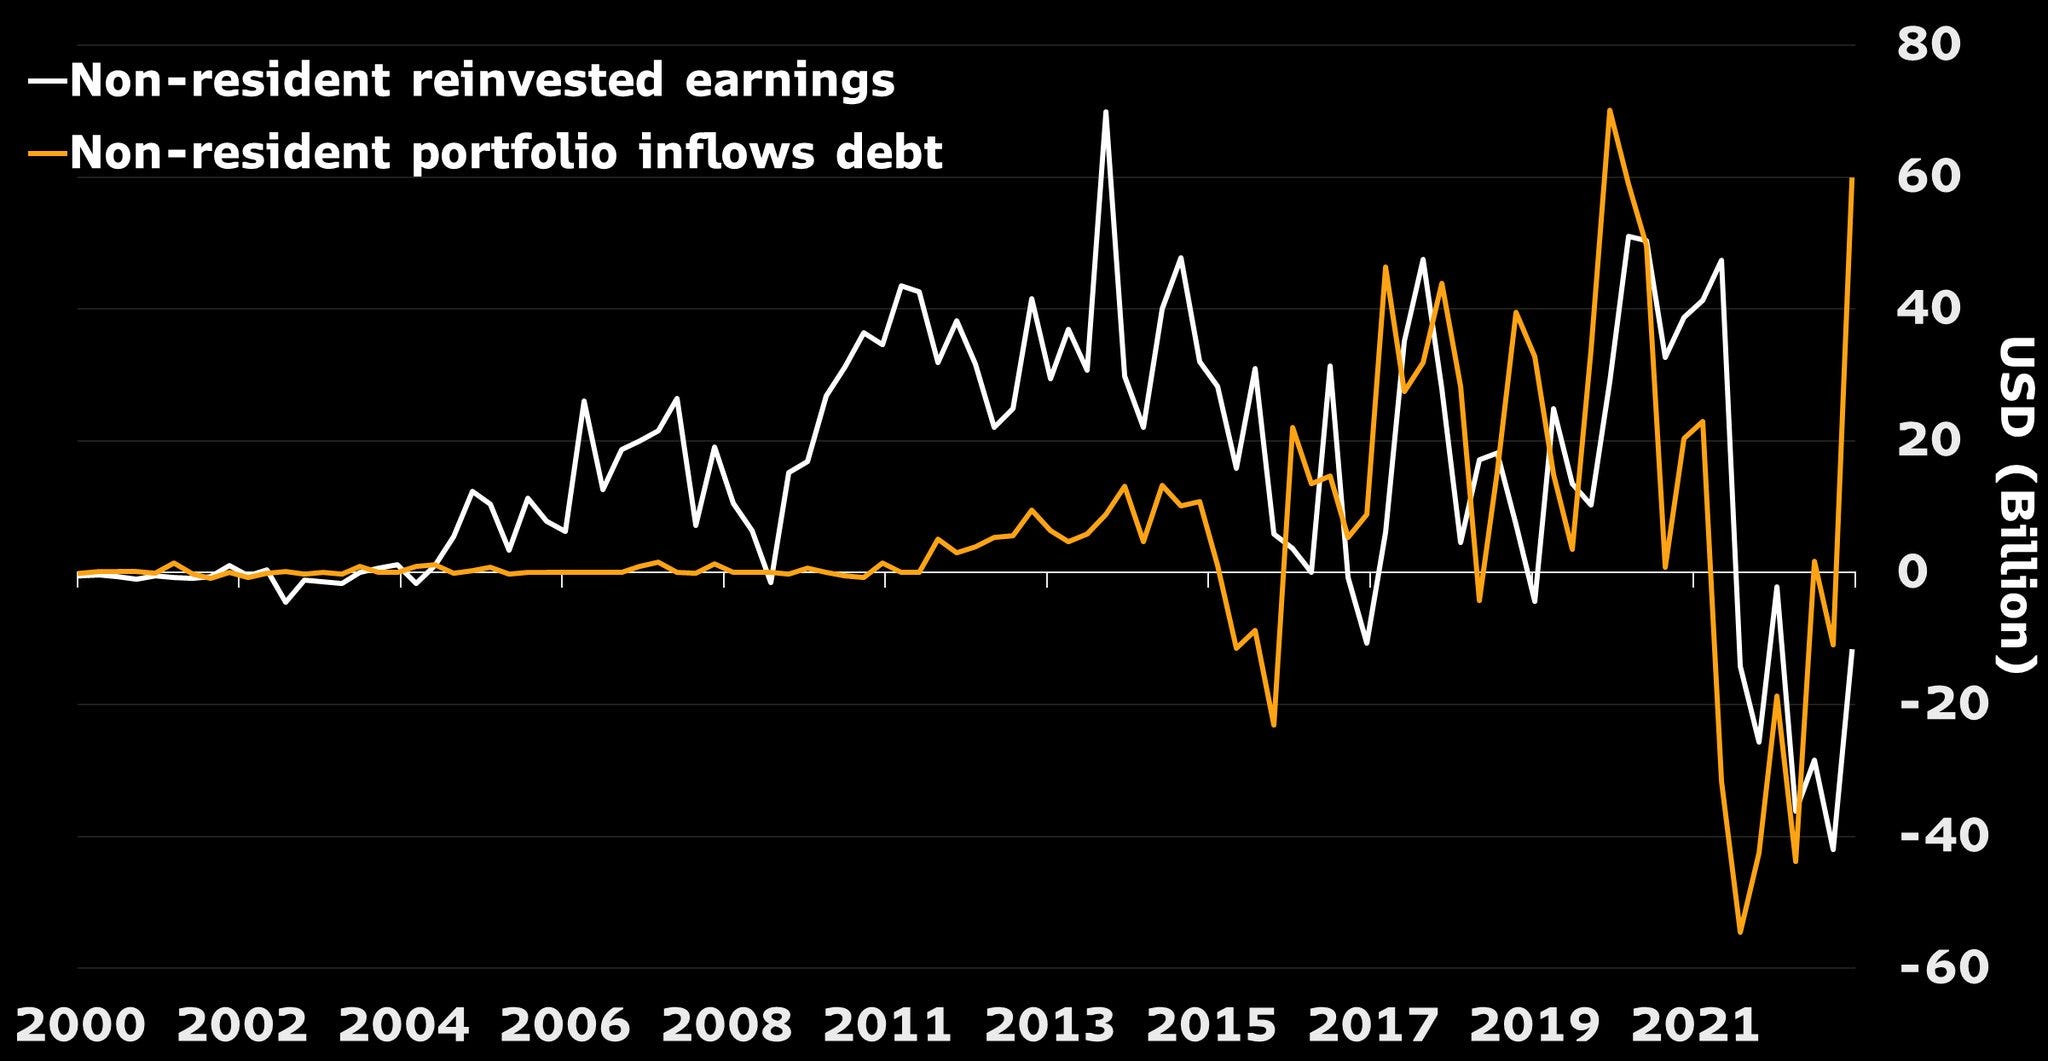
The theory is that when interest rates are higher in China, companies will choose to keep their cash in Chinese banks in the form of renminbi to take advantage of those higher rates. This would reduce the amount that they distribute in the form of repatriated dividends and thus increase the “reinvested earnings” estimation. Since this is just treasury management of liquid assets, this decision does not actually represent a true capital investment (in the form of plant, machinery, inventories, etc.) decision.
In my experience20, large foreign multinationals like Apple, GM or Starbucks do not play the “interest rate arbitrage” game and typically repatriate most of their retained earnings in China subject to local investment needs (e.g. expansion funds and working capital needs) and local regulations21. In contrast, the treasury management departments at Hong Kong-owned firms appear to be more prone to make directional bets on the USD-CNY rate which can result in more volatile swings in the flow of liquid capital that “pollutes” the “reinvested earnings” measure.
Overall I do agree with Gerard that macroeconomic conditions play a key role here and need to be taken into account as well.
Bottom line
Multiple trends and effects have contributed to declining FDI over the past three years. Due to the complicated mechanics described above, it is hard to know with full precision, but there are some noticeable drivers:
A primary driver is the gradual catch-up of Chinese players, which is now increasingly “crowding out” investment by foreign MNCs and companies. In certain sectors, this is causing foreign MNCs to slow the rate of expansion or in some cases (like Mitsubishi) completely pull out.
The downturn in the property sector has also caused large write-downs on previous FDI and associated accumulated retained earnings. This has contributed to the sharp drop in the “non-resident retained earnings” component of FDI.
Trade tariffs are also exerting a significant impact, particularly on foreign-funded exporters. This is hastening the redirection of real capital investment flows to regions such as Southeast Asia, India, and Mexico. Chinese firms are also increasing their investments abroad, which shows up in outbound FDI.
Lastly, macroeconomic conditions also play a role in the treasury operations of companies, impacting domicile and currency that they choose to hold their cash and liquid assets. Due to the way that reinvested earnings is calculated, this can also have a big impact on the “flow” data.
In 2022, after decades of predominantly net inflows (the black line in Robin’s chart), this figure turned negative, indicating that Chinese outbound investment had surpassed inbound FDI. This trend persisted in 2023, and I anticipate it to continue or even accelerate as many remaining exporters continue to shift their mainland China operations offshore. Additionally, Chinese manufacturers and brands are increasingly investing in local manufacturing in markets worldwide.
After decades during which China was a net importer of FDI, it is likely that in the coming years, China will shift to being a net exporter of FDI.
The State Administration of Foreign Exchange (SAFE) sits in the middle of all foreign currency transactions by regulating the foreign exchange operations of participating banks.
Within the Balance of Payments (BoP) tracked by SAFE, incremental new investment is tracked in the capital account while repatriated dividends would be tracked in the current account under “Direct Income”, a sub-category under “Investment Income”.
This is the cardinal rule of accounting; it must always eventually balance.
For example, companies started by Chinese nationals with offshore funds by re-investing those funds onshore in newly formed companies.
Source: Nicholas Lardy, PIIE “Foreign direct investment is exiting China, new data show” (November 2023)
“Both agencies include greenfield investment and mergers and acquisitions (M&A) by foreign firms in their FDI data while SAFE also includes several other items.”
Source: Homin Lee via Robin Brooks.
”Reinvested earnings from 2010 to 2014 explain 80% of this ‘flow’.”

Manufacturing (which includes most export processing firms and foreign MNCs), real estate and financial services represent the vast majority of FDI in China.
I am ignoring SOEs here as historically they have generally not competed in the same sectors as export-processing companies or foreign MNCs. They did play a role in an initial surge in outbound capital investment in the mid-2010s as part of Belt & Road (infrastructure SOEs but in this post I am putting greater focus on trends with inbound capital investment.
Automaking is a notable exception. SOE automakers played key roles as joint venture partners for foreign MNCs and are increasingly competitive with their own in-house brands, particularly NEVs.
While these export-processing operations continuously invested in capex to improve productivity, at their core they were still fundamentally labor-intensive manufacturing operations because of the nature of the industry sectors they focused on. There are limits to how much you can automate manufacturing in sectors like clothing, toys and the final assembly operations of consumer electronics. Despite advances in robotics and machine tools, it is still very difficult to replicate certain tasks that can be done by humans.
Note the rise of Chinese sellers on Amazon and other e-commerce sites.
There would be some adaptations to comply with regulations but generally foreign MNCs were looking at Chinese consumers as an incremental market opportunity to sell existing products and services into. They typically did not invest heavily in R&D or product development within their 50/50 joint ventures.
Source: Sheng Songcheng / archive (former PBOC director)
2012年,房地产和金融行业引资占比已接近30% “In 2012, the proportion of investment attracted by the real estate and financial industries was close to 30%”
Source: Sheng Songcheng / archive
In the early 2000s, manufacturing was the biggest contribution (~60%). At the high of the property boom in 2012, property and financial services became large contributors (~30%). Today, it has fallen to ~11% while manufacturing is on the rise again after many years of decline.
For instance, we know exactly how much money Apple makes in China and its net assets in the region. From here we can get a good idea of its incremental investment and reinvested earnings.
Sales of ICE passenger vehicles have fallen from a peak of ~24.3 million in 2017 to ~17.1 million in 2023.
Founded in 1955, GAC had also previously setup JVs with Toyota and Honda and also had its own in-house brands Trumpchi, Aion and Hycan.
From a statement released when it announced the restructuring of its China business: “Over the past 2-3 years, the Chinese automotive industry has faced rapid market changes. The shift to electric vehicles is accelerating faster than expected, and consumers are rapidly undergoing significant changes in their brand and segment choices.
We tried to recover our sales volume by releasing a new model in December 2022, but we continued to fall short of our plan and have suspended our production since March of this year in order to adjust our inventory. In light of this situation, we decided to fundamentally review our China strategy and implement structural reforms, as outlined below.”
Or possibly “due to” i.e. an effort to secure equipment before additional sanctions are imposed.
Source: Evergrande 2022 Annual Report
Evergrande had been “profitable” all the way through 2020, booking profits from pre-sales developments that would not be delivered until years in the future and using the deposits collected to finance existing projects through synthetic financing arrangements (and likely illegal, if not formally than in spirit). These profits are accumulated on the balance sheet in the form of retained earnings. When the assets are written down, this represents a large operating loss that will impact “reinvested earnings” component of FDI.
Mainly through decades of reviewing annual reports of publicly listed foreign firms that disclose segment operations in China including data on revenue, operating profit and net assets.
no terms of service acceptance test2
no terms of service acceptance test2