
Maslow’s Hammer: Tyranny of the Accounting Identity, Part II
The headline figures understate the real level of consumption by Chinese households
In Part I of this essay series, I explained the origins of the Over-Investment Thesis, the foundation of which is built on the idea that China’s Consumption (C) from the GDP accounting identity is extraordinarily low and long overdue to revert to the mean through “politically difficult re-balancing”. China’s economy is portrayed as an extreme outlier whose accounting identities must conform with global averages.
The accounting identity is Maslow’s Hammer of Chinese economic discourse. These days it seems every explanation, policy recommendation, and prognostication of the future revolves around the idea that China’s economy — reduced to an accounting identity — is imbalanced with too much investment and too little consumption.
Alternative, nuanced explanations are not countenanced, or hand-waved away in favor of this re-balancing narrrative. There is minimal questioning of the underlying assumptions or even the validity of the original assumptions that supported the thesis. Updated data and findings that raise questions about the predictive ability of this narrative are dismissed. Data that confirms the narrative is amplified.
These maxims are repeated in derivative conversations, and like the game of telephone diluted where repeaters often misinterpret the highly technical underpinnings of the narrative; when challenged, they make discussion-silencing appeals to authority. This is not objective analysis but behavior typically attached to conspiracy theorists and cults.
All while the fundamental basis of the narrative remains highly flawed, yet unquestioned. But it needs to be questioned to prescribe the right reforms at the right pace and better understand how things are likely to unfold.
Note: in this essay series, to distinguish between technical GDP accounting and colloquial definitions, I will generally refer to the technical definitions as “Consumption (C)”, “Investment (I)” (or “Gross Capital Formation”), and “Government Expenditures (G)” and the colloquial definitions as “consumption”, “investment”, and “government”.
Lies, Damned Lies, and Statistics
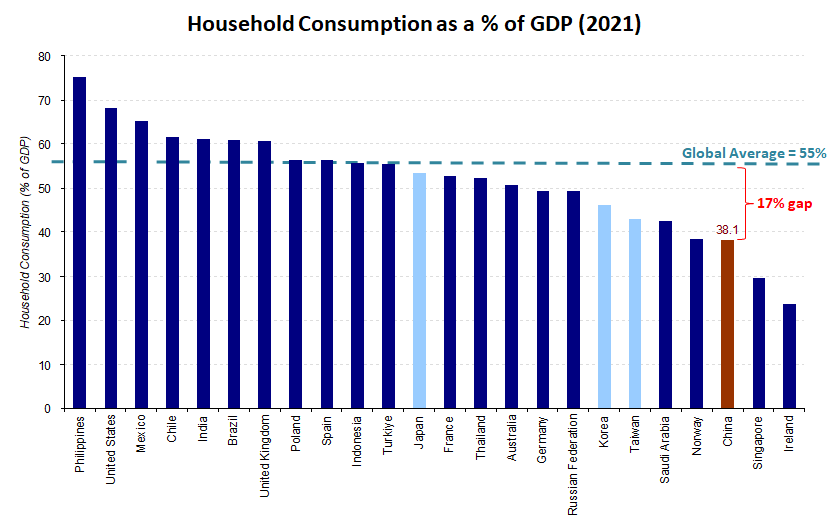
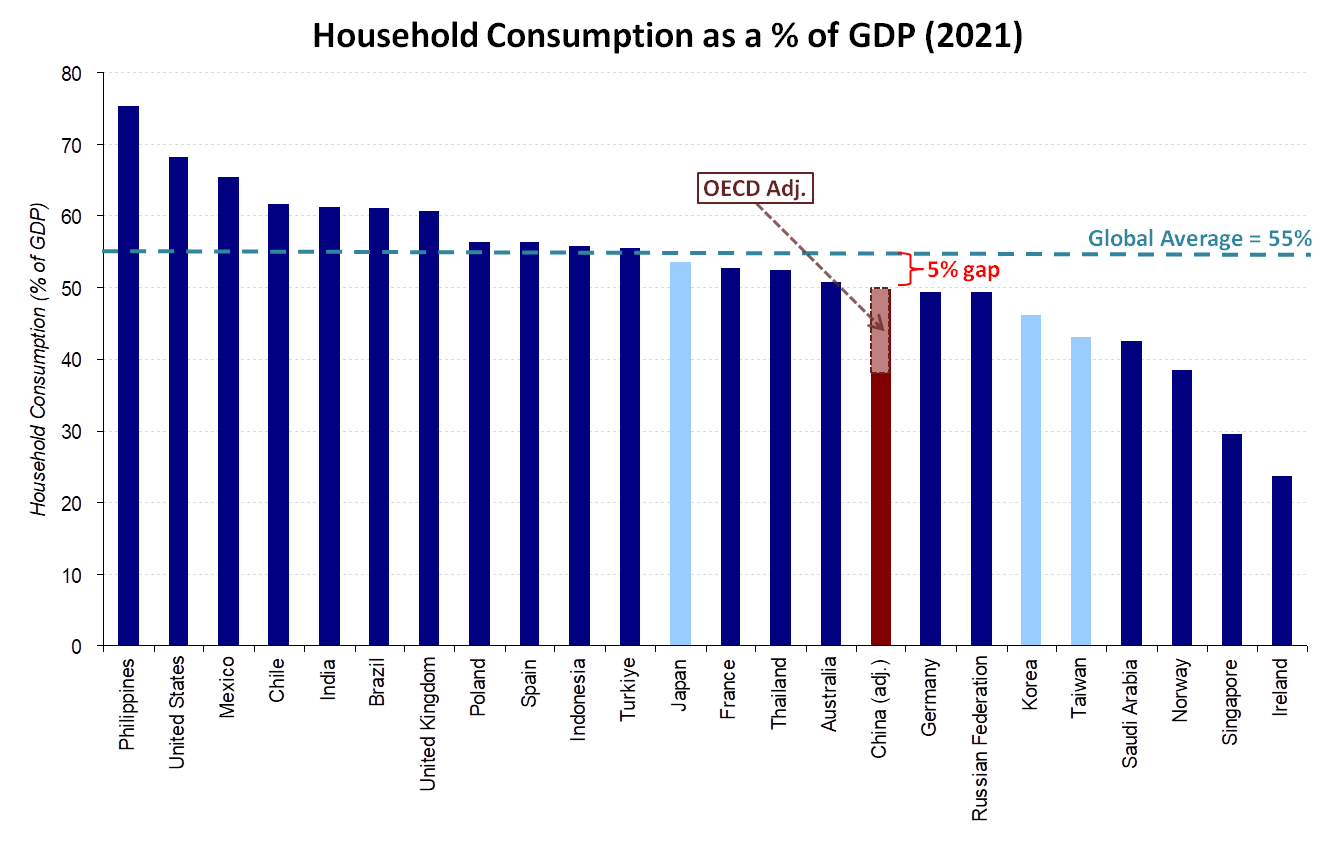
One of the core premises of the Over-Investment Thesis is that consumption is too low and needs to regress sharply to the mean. The key piece of evidence is this chart presented in Part I showing how China’s Consumption (C) as a percentage of GDP is “extremely low”, even when compared to economies that followed high-investment growth models like Japan, South Korea and other “Asian Tigers”:
But when you take a closer look at these numbers and pair it with a deeper understanding of how the accountants and economists formulate GDP, it will become very clear that, for a variety of reasons, China’s numbers are counted very differently from the others on this list, especially the OECD members, and need to be adjusted if they are going to be compared to others.
These adjustments will show how the headline Consumption (C) numbers for China significantly understate the true consumption of the Chinese household compared to the countries to which it is being compared. To understand how, we need to once again jump into the weird world of GDP accounting.
Technical jargon vs. colloquial usage
In Part I, we reviewed how the GDP “sausage” was made and hinted at how words like “consumption” and “investment” could mean different things in different contexts. In a GDP context, Investment (I) and Savings (S) are precisely defined but when the average layperson hears the terms “investment” and “savings”, they usually have something else in mind.
The diagram below shows how non-intuitive the GDP accounting identity categories really are and how they do not really match up well against actual socioeconomic groupings like the “household sector”. Private sector businesses do not even show up directly in the GDP expenditures approach, as the expenditures approach only measures final demand by households — businesses provide intermediate goods and these activities are not considered final demand.
Further complicating this is the overlap1 between socioeconomic groups like the “household” and other groups like the “government” and “private sector businesses” — ultimately the government and private sector businesses are made up by individuals that are also part of “households”.
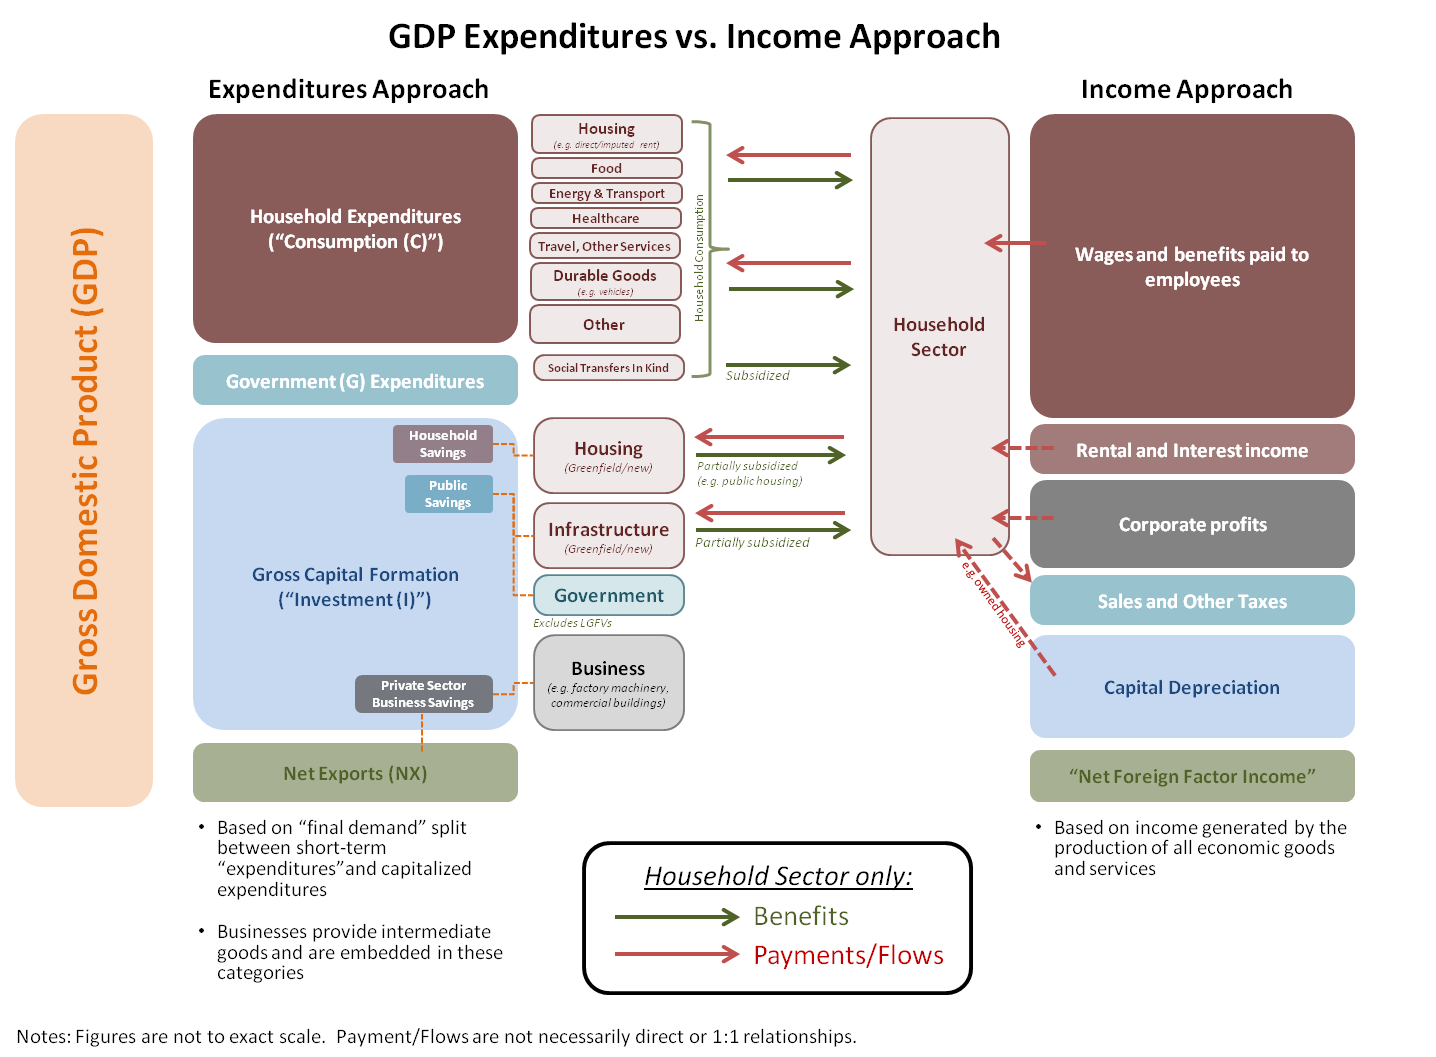
The expenditures approach and the income approach do not line up neatly; for instance, the relationship between Consumption (C) on the left side and household income on the right side is not a direct 1:1 relationship:
Consumption (C) itself can be broken down further into components like housing (but only the imputed rent or rental portions), food, energy & transport (but only the consumable components), durable goods, services and many others. All of this is attributable to the “household sector” and paid for with “household income”.
Investment (I) can be broken down into categories like housing, infrastructure and business investment. Its “housing” is related but ultimately distinct from the “housing” that is part of Consumption (C). The “residential housing” portion is greenfield construction activity that is ultimately driven by purchase decisions made by the “household sector” and also paid for out of “household income”. This shows up a “savings” and residential housing makes up the largest component of household savings in China2.
It’s not just consumption and investment that have very different colloquial definitions from their precise, technical GDP accounting definitions.
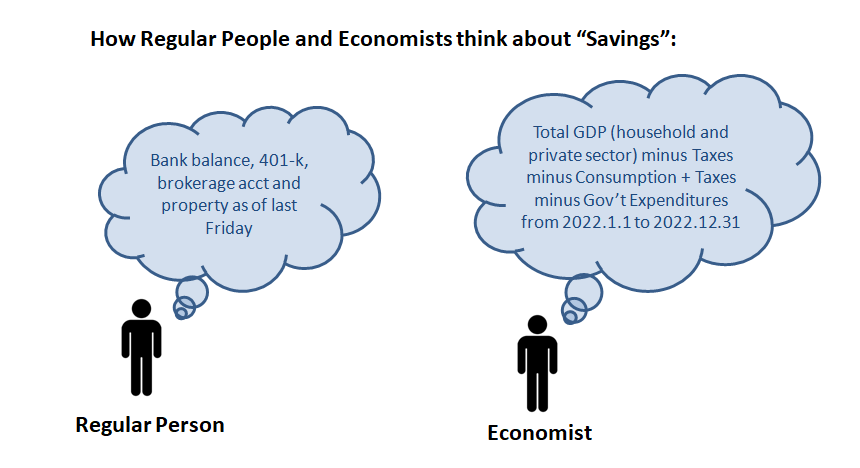
When the average person hears “savings” they probably think more of the cash and deposits in their bank, brokerage account and 401-k. In other words, it is a “stock” concept that is analogous with a balance sheet. But in a GDP context, Savings (S) is actually a “flow” concept — analogous to an income or cashflow statement — that is based on total GDP minus Taxes minus Consumption (C) (i.e. “savings of the private sector”) and Taxes minus Government (G) (i.e. “savings of the Government”). Savings (S) of the private sector can be further bifurcated into savings of households vs. private sector enterprises.
In official policy communication, it is typically the colloquial definition of these terms that are being used and not the highly technical GDP accounting identity definition. For example, in this strategic planning document by the Central Committee, the authors are clearly using the colloquial definition which includes housing construction:
The basic role of consumption continues to strengthen. The proportion of final consumption expenditure in GDP has remained above 50% for 11 consecutive years. Traditional consumption such as housing and transportation consumption has grown significantly, the per capita housing construction area of urban residents has steadily increased, and the sales of new cars have ranked first in the world for 13 consecutive years. New forms of consumption and new models are developing rapidly. In 2021, online retail sales of physical goods will account for 24.5% of total retail sales of social consumer goods, and per capita service consumption expenditures will account for 44.2% of per capita consumption expenditures.
(Translated by Google)
And just to make the point very clear, it goes on further to talk about investment and includes categories like healthcare and education in the discussion — which, in the GDP accounting identity would be categorized as Consumption (C).
The key role of investment is better played. The proportion of the country's total capital formation in GDP has been maintained at a reasonable level, providing strong support for optimizing the supply structure and promoting stable economic development. The level of infrastructure construction has been improved in an all-round way, the national comprehensive transportation channel has been accelerated, and a number of major water conservancy facilities have been completed and put into use. The construction of new infrastructure such as 5G has been accelerated, significant achievements have been made in the construction of major scientific and technological projects, and investment in high-tech industries has continued to grow rapidly. Weaknesses in the fields of medical and health, ecological and environmental protection, agriculture and rural areas, and education have been speeded up.
(Translated by Google)
GDP accounting identity adjustments
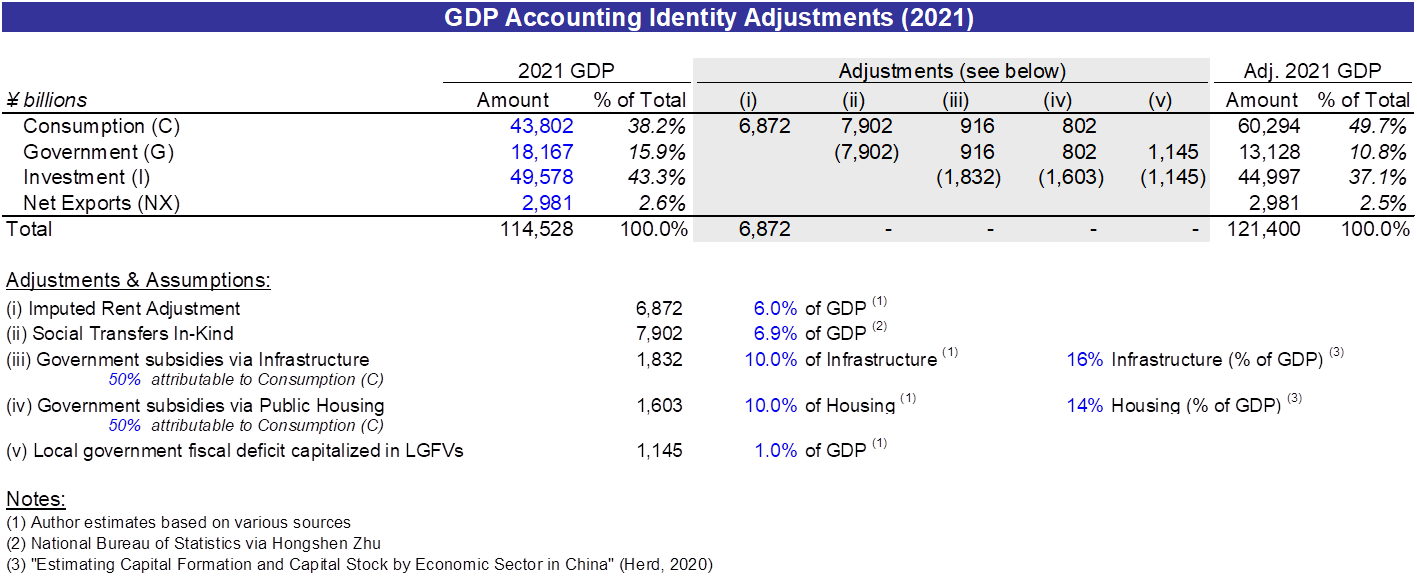
With this background in place, let’s start going through the adjustments with some real numbers. To align China’s GDP accounting identity figures with OECD members, there are at least three identifiable categories of adjustments:
Differences in GDP accounting standards with OECD economies
Differences in China’s economic structure and approach and how expenditures that should really be categorized as Consumption (C) are categorized as Government (G)
A certain portion of Investment (I) represents capitalized subsidies that would fall under Government (G) or Consumption (C) in OECD countries
(1) China’s conservative GDP accounting and its impact on Consumption (C)
To standardize GDP calculations, there are global accounting standards that countries try to adhere to when tabulating GDP. For various reasons certain countries are behind others in adopting the latest accounting standards and this leads to differences in how certain economic activities are measured.
Despite various claims about how Chinese GDP data is inflated3, it is actually quite conservative from an accounting perspective. China calculates its GDP using a modified version (CSNA-2016) that is formulated in accordance with System of National Account (SNA) 20084. SNA-2008 has been adopted by most OECD countries but within this standard there is significant leeway for accounting judgment.
A well-known difference is China’s conservative approach to calculating imputed rent. Imputed rent is an estimation of the value of housing “consumed” over a certain period — think of it as rent that you pay yourself (as the homeowner) to use the property. It is derived from applying a percentage to the value of owned residential housing stock. With 90% of Chinese households owning their own homes, for all intents and purposes, it is the how the vast majority of the housing consumption portion of GDP is calculated.
Historically, under CSNA-2002, imputed rent was calculated based on the cost basis, or book value, of residential housing, yielding a much lower imputed rent figure than if you were using market rates which are significantly higher. While calculations based on market rates are allowed under CSNA-2016, this particular change does not appear to have yet been implemented5.
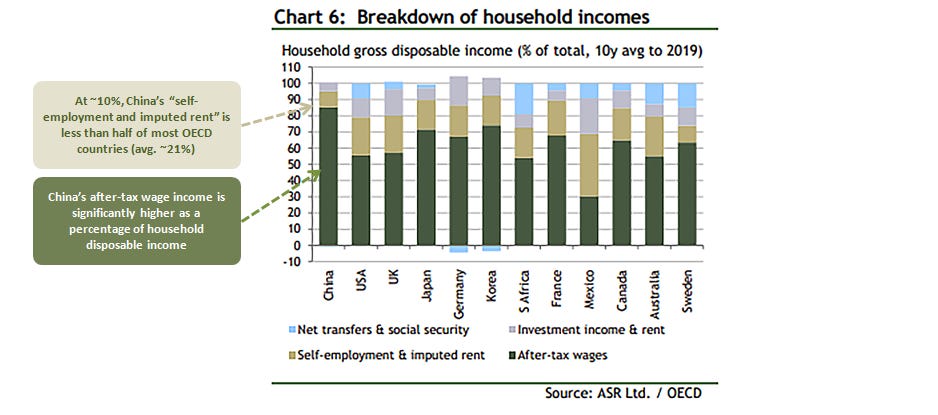
This conservative accounting is validated by comparing China’s imputed rent calculation with other countries. In this excellent data series, Adam Wolfe highlights how China’s imputed rent is a much smaller percentage of the economy compared to developed economies. Typically housing would make up a larger, not smaller, share of income for less-developed countries like China, so this is a strong indicator of this accounting difference.
Multiple sources corroborate that China’s GDP figures undercount imputed rent by amounts ranging from 4% to 8% of total GDP, or ¥4.6 trillion to ¥9.2 trillion of 2021 GDP. This is not an insignificant sum that would be tacked onto the GDP estimate and counted as Consumption (C). Besides imputed rent, there are other items from under-counted employment income to medical services to automobiles where China’s conservative GDP accounting generates a lower estimate of GDP, and they are almost all related to consumption factors.
(2) Government (G) spending on behalf of households and consumers
In China, the government provides subsized goods and services to certain segments of the household population. Prime examples of these are the thousands of community canteens (公社大食堂) in Chinese cities where certain groups like the elderly can get subsidized meals within walking distance.

At this community canteen in Shanghai, it’s an all-you-can-eat buffet for ¥28 per person with half-off discounts for senior citizens. This one has been open since 2019 and can accommodate eighty people at a time. In addition to lunch and evening buffets, it also provides à la carte breakfast and dining options that cater to specific communities. For example, fresh food can be prepared and delivered to elderly people who prefer to eat at home for ¥16. While these are run by private entrepreneurs like regular restaurants, their costs are subsidized by the government. The closest OECD analogy might be food stamps.
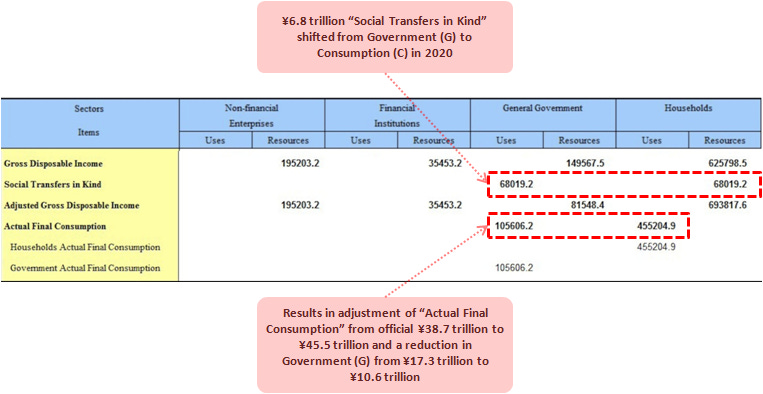
The subsidized costs of these community canteens are counted under Government (G) but they are benefiting households and should count as Consumption (C). Hongshen Zhu noted in a recent tweet that these subsidies equate to a 6.9% (of GDP) transfer to the Consumption (C) category. The National Bureau of Statistics officially provides for this adjustment in its annual accounts:
In OECD countries, social benefits are typically made via direct payments (e.g. social security) and show up in household income. Re-balancing advocates often comment about China’s “thin social safety net” and recommend that it increase direct transfers to the household to boost the household’s share of income which they contend would lead to more consumption. But these advocates fail to recognize that the government is already providing large transfers to households (7% of GDP), just in a different form.
That China takes a different approach — “social benefits with Chinese characteristics”, if you will — in a manner that is categorized differently under GDP accounting standards, does not take away from the reality that it is straight-down-the-fairway consumption6. It represents real household consumption, and for the purposes of this re-balancing question, should be re-categorized as Consumption (C) from Government (G).
(3) Components of Investment (I) are really embedded subsidies that should be re-classified as Government (G) or Consumption (C)
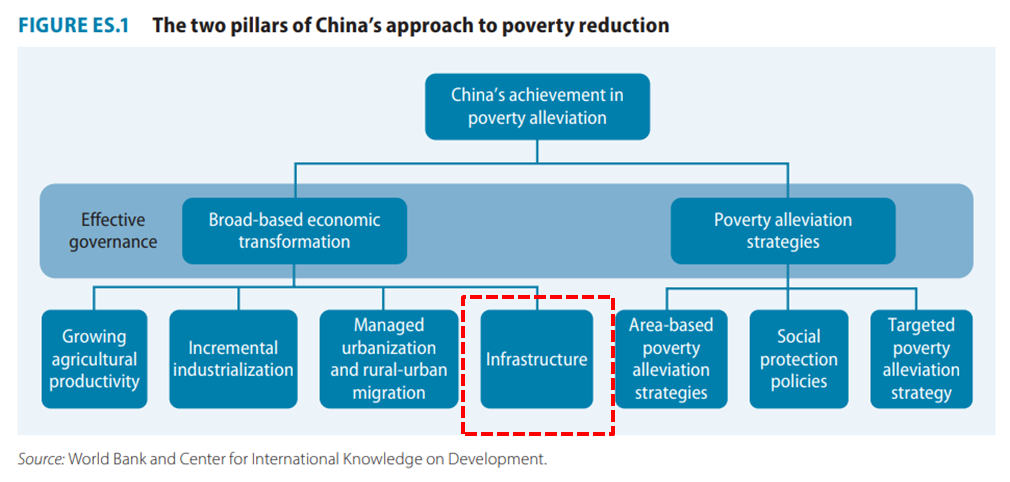
In Project Finance with Kweichow Characteristics, I discussed the role that poverty alleviation often played in investment considerations, particularly in less-prosperous provinces such as Guizhou. As you can see in the chart below, infrastructure is one of the pillars of China’s national poverty alleviation approach.
There are a number of ways that Consumption (C) and Government (G) might be disguised as Investment (I):
Poverty alleviation strategies that are funded through infrastructure projects
Subsidized housing programs funded through construction of public housing
Local governments funding ongoing expenditures by de facto borrowing from related-party LGFVs
First, infrastructure projects are typically funded through local government financing vehicles (LGFVs). The LGFV would inject equity (typically in the form of land) and borrow money to fund construction and development. Certain infrastructure projects had significant poverty alleviation elements in their underwriting mandates. They were not expected to fully support themselves with incremental revenue generated by the asset and might eventually need additional government support.
An example would be a bridge in heavily mountainous terrain that could cut down travel times from hours to minutes for local residents. While the bridge may not generate enough incremental taxes or tolls from lower-income local residents to fully cover its financing costs, it increases quality of life for local residents, effectively representing a transfer of wealth from the government to these local residents.
It is difficult to calculate exactly how much of a subsidy this amounts to, but one way of thinking about this is that a significant portion of LGFV losses can be attributable to poverty alleviation programs. If these “social losses” had been funded by the central government directly as part of explicit funding schemes — again, more similar to how it is typically done in OECD economies7 — then it would show up in the Government (G) column and not Infrastructure (I).
Second, similar to infrastructure, a portion of residential housing built over the past two decades has been in the form of public housing that is subsidized by the government. From 2010 to 2019, 141.3 million urban housing units were sold of which 29.5 million (~21%) were newly-built public housing units8. Construction of public housing since 2019 has been “slightly more resilient than private housing”. This report suggests that affordable housing subsidies of approximately 1% of GDP were granted in 20129 as a proxy for capitalized Infrastructure (I) related to affordable housing programs. This adjustment is likely conservative.
Third, local governments have been using related-party LGFVs to borrow funds that are being used to fund ongoing expenditures. This is a legacy of a conservative banking system and central government controls that were put in place to limit direct borrowing. I also discussed this point here in Project Finance with Kweichow Characteristics. Under a different system, these capitalized expenses would show up under the Government (G) category as fiscal spending.
This number would be a portion of the “augmented fiscal deficit” metrics that the IMF has used to augment the official view of local government finances with the net borrowing activities through related-party LGFVs. The IMF calculated the augmented deficit at 13.8% of 2021 GDP, most of this driven by LGFV activities (vs. local government fiscal deficits). For the purposes of this exercise, I am assuming 1% of GDP that has been capitalized in Investment (I) that should really be in Government (G) in the adjusted GDP accounting identity. Again this adjustment figure may be conservative.
Summary adjustments: China’s true Consumption (C) is closer to 50% than 38%
Pulling this all together, China’s true Consumption (C) percentage is closer to 50% than 38% and its adjusted Investment (I) percentage is closer to 37% instead of 43%.
Said another way, if China used GDP accounting and approaches — like direct instead of in-kind transfers — more similar to OECD members, this is where its GDP component percentages would be.
Other economists have also researched and corroborated these adjustments. Zhang Jun at Fudan University estimates that adjusting for these accounting differences, China’s true household consumption should be 10-12% higher than the official rates. For 2021, this would imply Consumption (C) as a percentage of GDP between 48% to 50%, similar to where I ended up with my analysis.
With the proper “OECD adjustments” in place, while still low, China’s consumption is not as extreme an outlier from global averages. The need to “re-balance” goes away when you more accurately benchmark China’s consumption numbers to others and eliminates a core pillar of the Over-Investment Thesis — that China is an extreme outlier10.
We can tie these concepts back into the diagram we reviewed earlier by breaking apart the top-level accounting identities into smaller components and attributing these components to socioeconomic groups like the household sector (generally colored in maroon). For example, the diagram depicts 7% out of 16% of Government (G) expenditures are really in-kind social benefits for the household sector that would have been classified under Consumption (C) for most OECD member economies.
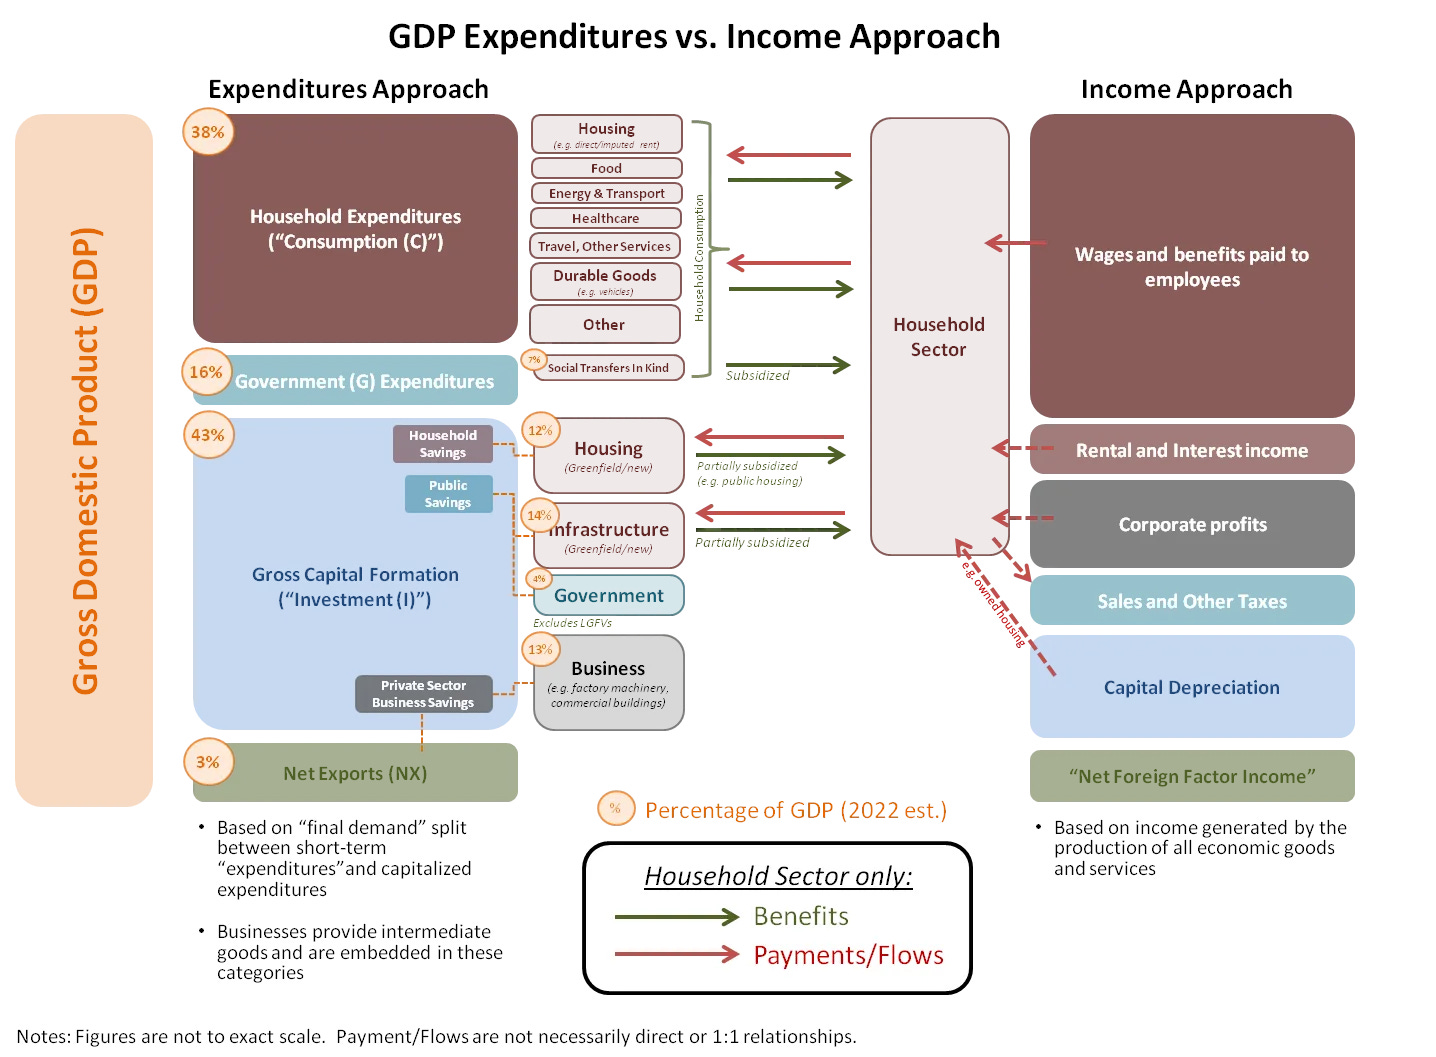
This diagram gives a much clearer view on how GDP can be attributed to the household sector.
The Right “Comps Set”
Beyond making these technical accounting adjustments, there is an even bigger question at play here. Implicit in the observation that China’s consumption percentage deviates from the rest of the world is the idea that the global average is the correct model for China to conform to.
But why should China be expected to conform to this particular group of countries, at this particular time? China today is at a very different phase of economic development from most advanced OECD members. Compared to middle-income countries, it is pursuing a differentiated growth model. The assumption that there is a universal standard that every economy must conform to is simply a bad assumption to make.
I find the original list of comparable countries problematic, particularly as it relates to benchmarking Consumption (C) as a percentage of GDP. With a few exceptions, all of the economies on the list are fully urbanized. China is still in the middle of rapid urbanization, having averaged ~20 million new urban residents a year for the last two decades. These new urban residents need homes and greenfield construction of apartment buildings drives Investment (I) at the expense of Consumption (C). The urbanization difference mandates that China’s Investment (I) as a percentage of GDP will be elevated compared to mature economies. The inverse is also true because of the accounting identity: Consumption (C) must be lower.
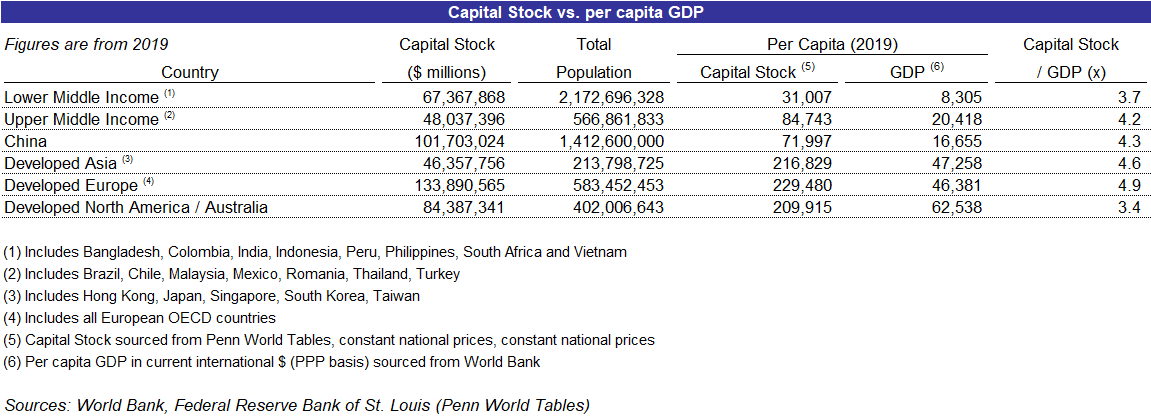
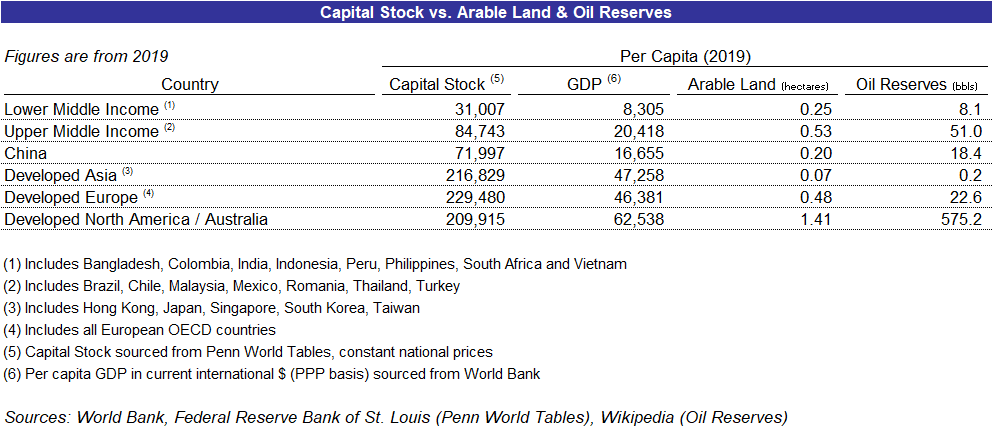
China works with a very different capital and labor structure from the median economy. China has a massive population and relatively little land and natural resources. In other words, it is over-supplied on labor and under-supplied on capital. The only practical way to address this imbalance is by building which will necessarily result in elevated Investment (I) as a percentage of GDP for a lengthy period of time. Even after almost two decades of heavy investment, China is still under-capitalized compared to other economies at the same level of development11:
Basic developmental challenges that China faces are most similar to the ones other “Asian Tiger” economies like Japan, South Korea and Taiwan faced. Like China, they suffer from a relative dearth of land and natural resources and used a high-investment growth model over many decades to build up their capital stock and grow their economies.
Whittling down the list to these much more comparable “Asian Tigers” makes the comps analysis more meaningful. But we cannot compare their Investment (I) and Consumption (C) rates to “Developed Asia” economies today as they are already fully urbanized and developed. We need to reach back into history and see what their numbers looked like when they were at a similar phase of urbanization as China is today.
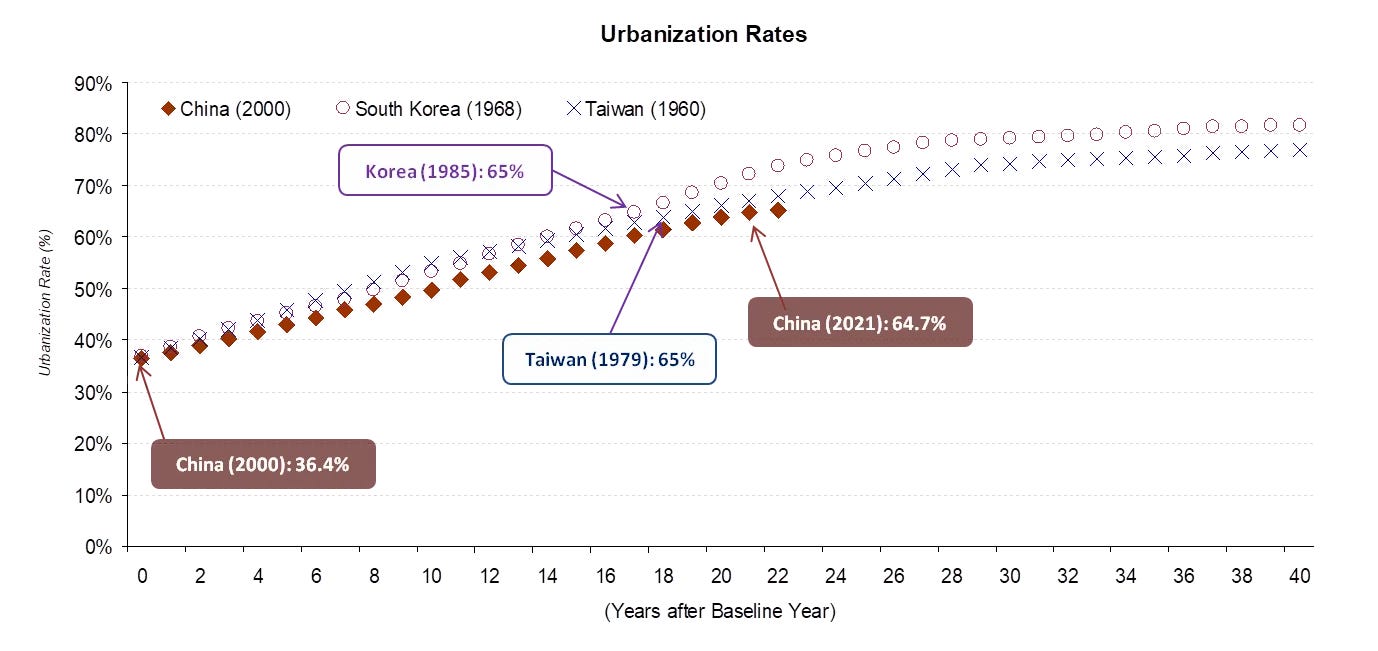
China was at 65% urbanization in 2021. Taiwan and Korea were at those points in 1979 and 1985, respectively. Japan reached this point in the early 1960s.
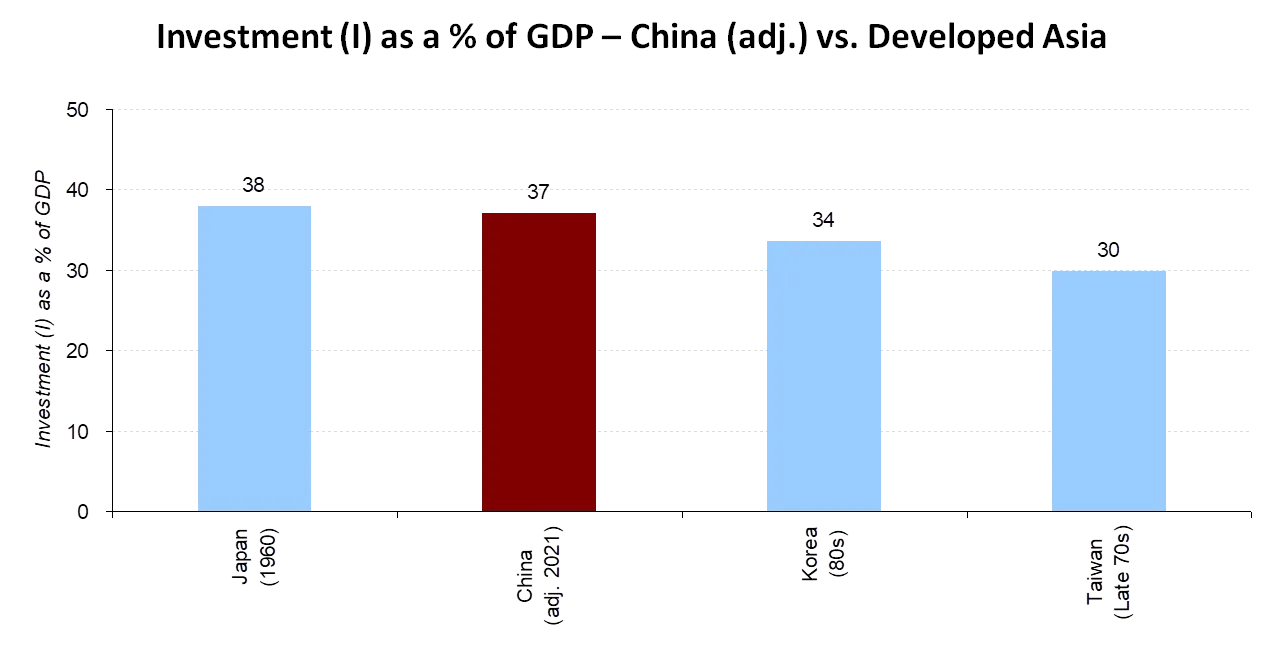
China’s adjusted investment rates are slightly lower than Japan’s in the early 1960s and moderately higher than South Korea in the 1980s and Taiwan in the late 1970s. Taiwan is a bit of an outlier here. Out of the “Asian Tigers”, its economic development relied less on heavy industry and more on small and medium-sized family businesses that developed capital-light export-oriented business models. Moreover, during much of its urbanization drive, Taiwan’s authoritarian government prioritized economic resources on defense and re-taking the mainland, with specific regulations in place to limit the amount of investment that could go into residential housing. As a result, Taiwan’s investment rates lagged the other “Asian Tigers”.
The inverse of high investment rates are low rates of final consumption expenditures. In his analysis of adjustments to Chinese consumption rates, Zhang Dun noted that China’s consumption rates of “60-65%”12 are comparable to the “Asian Tigers” during their high-growth periods:
Japan’s consumption rate was only 64-70% from 1968 to 1997. Hong Kong’s consumption rate in the past 50 years was around 60%. Taiwan was around 70%. These East Asian economies have one thing in common with China: they are all high-growth economies …
… based on these consumption rates, we can speculate on the future growth prospects of the Chinese economy. With consumption of the four “Asian Tigers” at 60%, more than 30% of GDP was used for capital investment. After all, the improvement of productivity ultimately depends on the formation of capital to drive rapid economic growth …
… if 70-80% of our annual national income is used for consumption, there will be fewer investments in technological research and development, capital will not be formed as quickly and labor productivity will not increase rapidly, limiting future economic growth prospects. The experience of the four “Asian Tigers” illustrated these points.
(Excerpts translated by Google)
Compared to its most relevant comparables at the same stages of economic development, China’s investment rates are high but not extraordinarily high13. Far from being a cautionary tale, if anything the astonishing economic success of the “Asian Tigers” offers valuable lessons for relative latecomers like China to borrow from the same playbook and follow similar development principles, including a model based on high savings and investment.
Ultimately, using the GDP accounting identity as Maslow’s Hammer diverts attention from what should be the main goal of any economy — maximizing the long-term growth of an economy and improvements in quality of life for its people. Instead of focusing narrowly on an obscure set of accounting identities, we need to focus on how to maximize long-term growth rates. Tunnel vision focus on the GDP accounting identity obscures a deeper and more complex, but ultimately more accurate way of analyzing the Chinese economy.
This is why in the simplified Expenditures vs. Income approach diagram from Part I, I presented the “household”, “private enterprises” and “government” as overlapping circles.
For the past two decades, tens of millions of people every year have been moving into the cities from the villages, driving greenfield construction which is categorized under the GDP expenditures approach as Investment (I).
In other words, within the GDP accounting identity, the household sector is driving all of Consumption (C) but is also driving a large component of Investment (I). Households are the ones choosing to purchase apartments and driving what is by some estimates a third of total Investment (I). For most Chinese, real estate holdings make up the majority bulk of savings and assets.
I wrote about work by Harry X. Wu on “inflated” Chinese GDP. Wu’s data series is referenced in Michael Pettis’ Trade Wars are Class Wars.
Previously, China was using a standard (CSNA-2002) that was based on SNA-1993. The biggest change from SNA-1993 to SNA-2008 was the inclusion of R&D into GDP accounting. Adopted in 2017, this resulted in moderate revisions in China’s GDP figures that need to be applied retrospectively to get apples-to-apples growth figures. GDP estimation is a highly technical and continuously evolving calculation. Here is an example of the sub-topics Chinese GDP accountants were debating in 2022.
Moreover, the assumption on useful life appears to be very high (50 years), also resulting a conservatively calculated imputed rent figure.
The most likely reason is that most re-balancing advocates are simply unaware of these community canteens and how they impact GDP calculations differently from OECD economies.
An example of this would be the billions of dollars spend on U.S. Route 48 (a.k.a. “Corridor H”) in West Virginia, a 153-mile stretch of highway that is part of the Appalachian Regional Development Act of 1965.
Source: Morgan Stanley
Source: “China’s New Affordable Rental Housing Strategy” Section 2.7: “From 2007 to 2012, the central government’s grants for the sector surged from RMB8 billion to RMB217 billion, along with tax reductions, exemptions and financial sector support amounting to several times as much.” Assuming the full subsidy package was 3x, or approximately ¥600 billion, this would amount to approximately 1.2% of 2012 GDP of ¥53.9 trillion. The actual amount of Investment (I) related to public housing would be higher. Housing makes up about one-third of Investment (I) and 15% of GDP. Assuming 15% of it is attributable to public housing (~21% of units) would equate to 2.3% of GDP.
Similar adjustments, to the extent they are meaningful, should also be made for the others on this comparables list. However, it should be noted that these adjustments are largely based on structural differences that are relatively unique to China — with most countries relying on direct transfers for social and welfare benefits (which would result in the GDP showing up in Consumption (C)) and the adjustments to Investment (I) largely based on the utilization of of LGFVs, which are also relatively unique to China. In other words, these particular adjustments are relatively unique to China and unlikely to be material for the others on this list.
These ratios understate the amount of assets and capital that other economies have compared to China as capital stock does not factor in land or natural resources. For a more in-depth discussion, you can refer to this recent Twitter thread.
Also note that I have, based on this thread, updated the tables to use per capita GDP on a PPP-adjusted basis instead of nominal. Capital Stock data sourced from Penn World Tables is presented on a “constant prices” basis which is very similar to PPP-adjustments. It is more accurate to use PPP-adjusted per capita GDP data in the denominator instead of nominal.
These figures include government consumption/expenditures alongside household expenditures for in the total consumption figure.
There is also a credible argument that China’s quality of housing and infrastructure investment are significantly higher than the “Asian Tigers” at the same stage of urbanization.
Glenn, thanks for insights and sharing. You might have missed one point that OECD countries also have social transfer in-kind from government to household. US's social transfer in-kind accounts for ~6% of GDP, almost the lowest among OECDs. Regarding the first chart you use in this article. "household consumption as % of GDP (2021)", the OECD data actually don't include social transfer in-kind. e.g. the household consumption of US 2021 is 68% and 74% for excluding and including social transfer in-kind respectively. It's clear that the US data is 68% in your chart. You can refer to "OECD (2023), Household spending (indicator). doi: 10.1787/b5f46047-en (Accessed on 19 September 2023)" for the details. Be noted to choose "including government transfers" if you want to include transfer in-kind. Also be noted that the data for China is not updated. China has officially included "social transfer in-kind" in NIPA accounting since 2018, and named it as "the actual final comsumption". I don't think my point will disapprove your conclusion on which I fully agree with you, but it does weaken it somehow.
Glenn, you have explained GDP better than my economics professor. I am very grateful for this piece. I was always confused about how terms like "Consumption" and "Savings" correspond with day-to-day usage. No one seems to be asking, and academics seem to treat this type of question as non-issue, only to laugh at. But I believe this is precisely the most relevant question to ask. Unfortunately, I guess you won't seal the debate with your wonderful writing for how China stacks up against these definitions. Doubters gonna doubt, believers gonna believe. But I will give you 100% credit for helping readers understand basic concept like GDP.