
newsletter | 2023.7.20
LGFVs with Korean characteristics, different levels of HSR performance, lack of confidence in the Chinese household and private sector, quantifying malinvestment in the real estate sector
I have continued to power through my deep dive into LGFVs, and took a bit of a detour as I read more about Korean chaebols and their experience during the Asian Financial Crisis. I think there are lessons from that experience that are relevant for Chinese LGFVs today. It is by no means a perfect comparison (these don’t exist in macroeconomics), but it is more relevant than the comparison with Japan in the 1990s.

I am still collecting my thoughts on the various reform paths for LGFVs. I thought that I could capture it all in one final series post but it is getting long so I may have to split it into two.
This past week on social media there were a number of interesting conversations on a number of topics. I have pulled out the most interesting ones and summarized below.
musings
Quantifying malinvestment in Chinese real estate (2023.7.19)
In the debate about capital efficiency in the Chinese economy, particularly real estate assets, residential vacancy rates are a key metric to estimate wastage and malinvestment. At the end of 2019, Chinese households were sitting on $33 trillion in residential real estate. This compares with $99 trillion in total capital stock1.
Residential vacancy rates across 28 Chinese cities are approximately 12%. Cross-country comparisons suggest that China may be higher than other countries by up to double2. If we assume that the global standard for residential capital efficiency should be half, this would mean 6% of outstanding Chinese residential housing stock could be considered “bad” GPD.
Combined with around $1 trillion of potential bad real estate assets sitting on the balance sheets of LGFVs, one can argue 3% of GDP equivalent gross capital formation may have been wasted3. From 2010 to 2019, investment as a percentage of GDP averaged 45%. Removing all this potential “bad” investment and replacing it with consumption-oriented expenditures would have lowered it to around 42%.
HSR — the Good, the Bad, and the Mierda (2023.7.17)
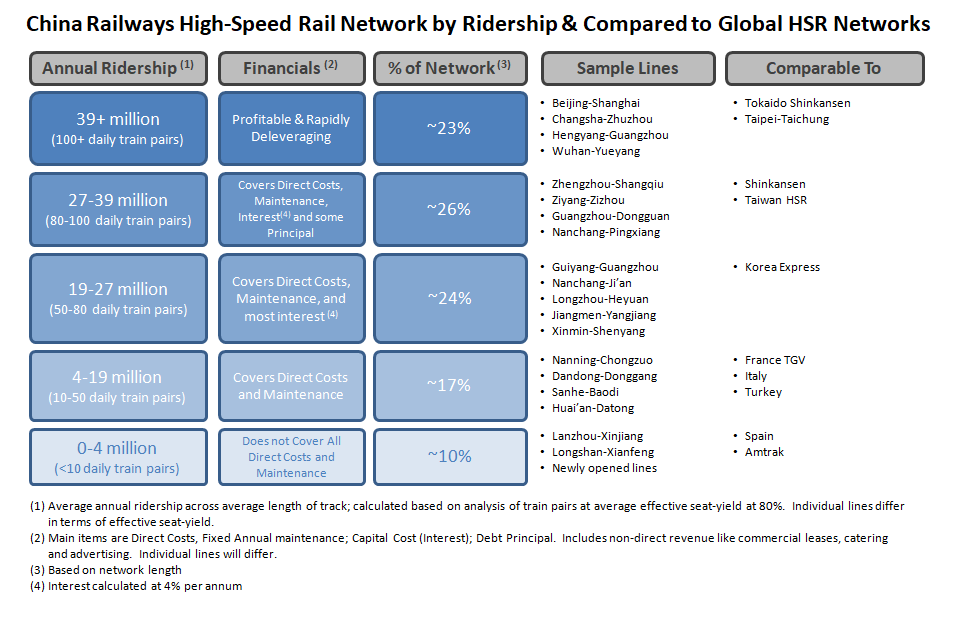
In the table below, I separated various Chinese HSR lines into grades based on the level of ridership, which can be estimated based on the number of daily train pairs on a line4. At the top end, lines like the 1,318-km Beijing-Shanghai line rivals the highest-usage lines in the world: Japan’s Tokaido Shinkansen line running from Tokyo to Osaka. At the bottom end are lines like the 1,777-km Lanxin line5.
As with everything else in the Chinese economy, HSR was a mix of good and bad projects. This nuance is often lost with the tendency to over-simplify.
“Savings” means something very different to economists vs. regular people (2023.7.16)
The definition of “Savings” in a GDP accounting context is very different from the definition “savings” that most regular people have in mind. This can cause confusion and misinterpretation in discussions about the Chinese economy and its tendency to “save too much”.
How HSR indirectly reduced GHG emissions (2023.7.15)
There is a non-linear relationship between velocity and energy consumption. This means that passenger travel by HSR consumes significantly more energy than passenger travel by conventional track. And because the current Chinese grid is dominated by coal, HSR replacing motor vehicles has actually raised GHG emissions over the past decade.
So how did HSR still led to overall reduced GHG emissions? You may recall one of Zhao Jian’s arguments was that China should have invested more in its freight network. It took some time, but this is exactly what has happened. As HSR lines grew in popularity, conventional lines were ramped down and eventually converted to freight traffic instead. Bulk freight transport is as much as three times more efficient than trucking. Shippers started shifting their bulk freight loads from ICE-powered lorries to freight trains.
The GHG savings here have more than offset the increase in emissions from shifting to electrified HSR passenger traffic (powered by a coal-dominated network). That said, with the rapid rise of renewables and the likely peaking of coal consumption in the next 2-3 years, the de-carbonization benefits of HSR will really start to compound.
Lack of confidence in households and the private sector (2023.7.13)
Confidence in this context is the level of certainty in the future.
The triple-whammy of zero-COVID, crackdown on technology and for-profit eduction sectors and “Three Red Lines” liquidity tightening has eroded the confidence of households and the private sector in China. While zero-COVID was an exogenous factor, it is now over. The other two are self-induced and from that perspective it is within control of policymakers to remove these overhangs.
This does not mean avoiding potentially difficult reforms — particularly in the local government / real estate sector. Indeed, signaling what these reforms are could bring the clarity that increases the confidence of households and private sector companies.
Cross-country wage comparisons (2023.7.11)
Cross-country comparisons are always challenging because of different ways of calculating metrics and different practices between countries. For example, in China, it is very common for room and board to be includes as part of the compensation package, especially for lower-wage workers. When we compare the wages of manufacturing workers in China to other countries, we need to keep this in mind. Some data series will adjust for this, but others may not.
charts & data
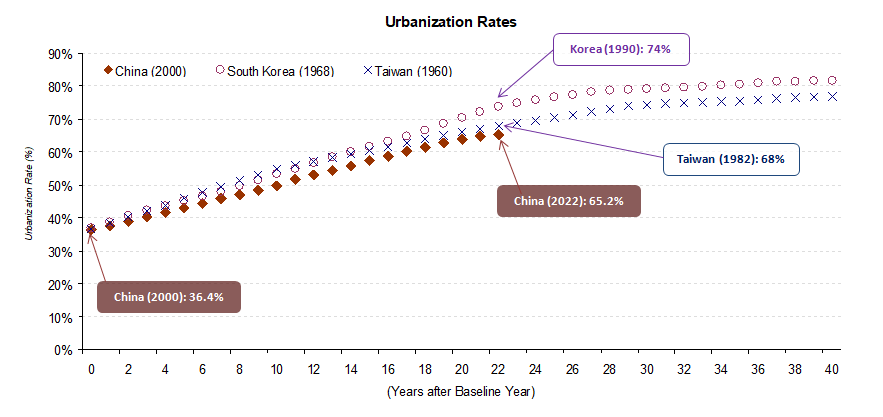
China has been undergoing a multi-decade urbanization boom. Past precedents like South Korea and Taiwan suggest that urbanization is a process that takes around four decades.
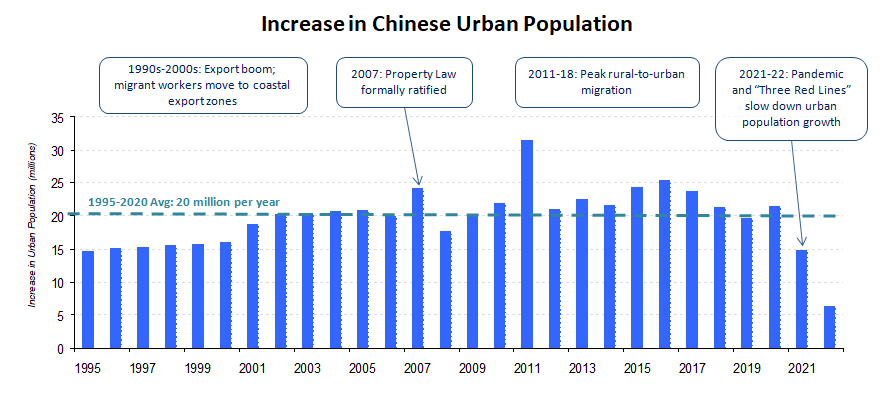
In China, there has been a fairly consistent stream of rural villagers moving to the cities in search of jobs and a better life for themselves and their kids, averaging 20 million per year over the last 25 years. For the first time in more than two decades, this rural-to-urban migration feell well below that average. Was this a function of the pandemic or is it a harbinger that China’s urbanization path will deviate?
from the archives
Is China’s state-driven model running out of gas? (2019.7)
This seems like the age-old question that everyone is interested in. More comparisons to other “East Asian Development” economies.
Why is China’s growth rate slowing down? (2018.9)
Explaining China’s growth rates through three archetypes.
On electric vehicles and vertical integration (2018.6)
How important is vertical integration to success in electric vehicles. Interesting to look back on my thoughts from five years ago. I think vertical integration is more important than it was back then and will separate the big EV winners from the rest of the pack.
diversionary
In the post LGFVs with Korean Characteristics, I shared a link to H.O.T.’s “Candy”, the first modern Korean boy band. But if you were to ask my Korean friends who the real K-pop O.G. is, it would be Seo Taiji.
Andrew makes a good point that this residential wealth figure and the capital stock figure are not exactly apples-to-apples comparisons, which I agree with. The residential real estate figure is a based on market values, which are higher than book values. The capital stock figures are book values, and subject to depreciation. Moreover, residential real estate includes the value of land, which while included in measures like Fixed Asset Investment, does not actually factor into gross capital formation in the GDP calculation. As it relates to this topic, the book value of the underlying gross capital formation associated with residential real estate is going to be lower than the $33 trillion.
Rogoff & Yang (2020) presented cross-country comparisons of residential vacancy data based on 2017 data. First, we need to acknowledge that this data is more than six years old. Residential vacancy rates can differ wildly based on definitions. For example, the U.S. data in the chart includes “homes not occupied, not for rent or sale” which would include people’s second or vacation homes, according to Michael. In China, there is a common phenomenon of families purchasing homes in new developments for the future. This could be a rural villager purchasing an apartment in their nearby city that they plan to use when they retire or an apartment purchased by urban parents for their children. This apartment could be empty for some period of time (and not rented out) before it is finally lived in. This contributes to lower residential vacancy rates in China.
This is likely conservative. Footnote 1 explains why the amount of gross capital formation associated with the residential real estate is overstated (market vs. book value). Footnote 2 explains why there may have been some valid reasons for China’s residential real estate vacancy rates to be higher at this stage in its urbanization.
China Railway targets 80% effective load factor (Source: World Bank No. 69). While individual lines may differ, the railway operator will continuously adjust train pairs based on expected traffic based on this rate. To estimate ridership, I use an average of 10 cars per train (EMUs are a mix of 8 and 16-car trains), ~70 passengers per car and an 80% seat-yield.
The Lanzhou-Xinjiang high-speed rail line is also a dual-use track that can carry freight.