
Is High-speed Rail in China a "Gray Rhino"?
A detailed response to Zhao Jian's 2019 essay on over-investment in HSR in China
In 2019 Professor Zhao Jian from Beijing Jiaotong University wrote an essay that argued that high-speed rail (HSR) was a potential “gray rhino” for China. A “gray rhino” is a “a highly probable, high impact yet neglected threat”, a cousin of the phrases “elephant in the room” and the improbable and unforeseeable “black swan”. Zhao has long been skeptical about HSR and has been making similar arguments as far back as 2010.
Zhao’s essay has become one of the most cited sources by those making bearish arguments about Chinese HSR and become one of the “go-to guys” for journalists who write about HSR for the “bear” perspective.
Zhao believes China is building too much HSR. While some of the arguments have changed over time, the 2019 essay made three main points:
Debt and associated financial risk
Low utilization outside of a few main lines
Opportunity cost of under-investing in the freight network
In this essay, I will take each of these points in turn and respond. There were quite a few issues with his supporting analysis.
The most egregious flaw was simply using data that was really old. Even though he published this essay in 2019, he used data from the 2015 to 2016 period. In a rapidly growing industry, using data that is 3-4 years old is inevitably going to lead to the wrong conclusions. For my analysis and responses, I use data from the time the essay was written.
(1) Debt and associated financial risk
Zhao argues the rail system has too much debt and incremental HSR revenue cannot even cover the interest let alone operating costs. He writes:
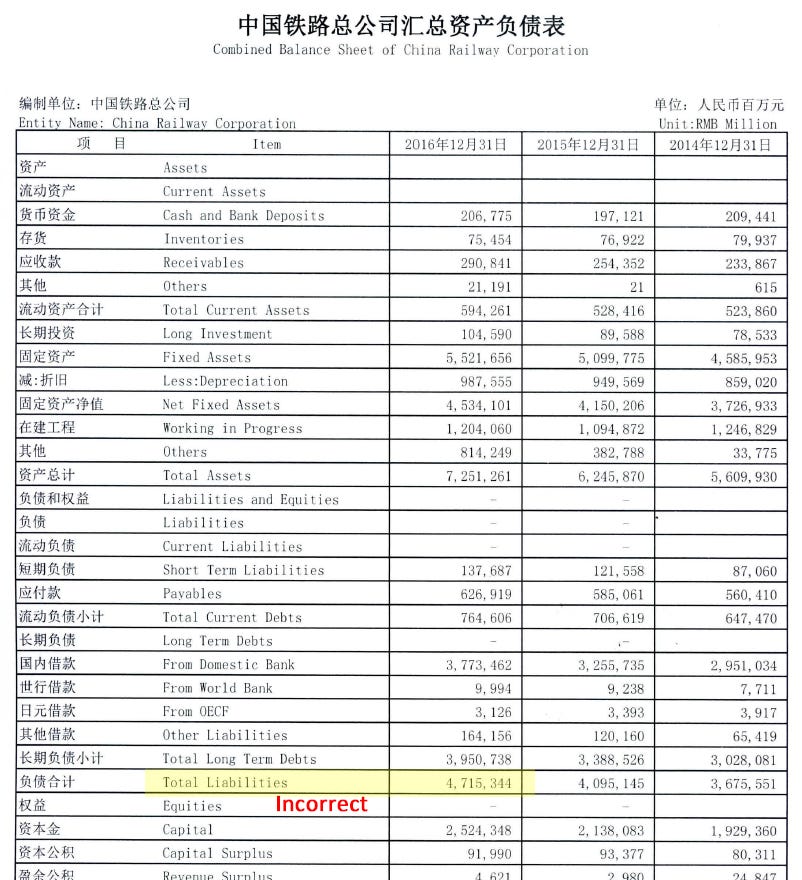
China’s high-speed rail is mainly financed by debt. Large-scale high-speed rail construction has led to the debt of China Railway Corporation (formerly the Ministry of Railways) soaring from 476.8 billion yuan in 2005 to 4.72 trillion yuan in 2016. China Railway Group keeps the income and expenditure of the high-speed rail strictly confidential, but from its published data on liabilities and passenger revenue, it can be concluded that even without considering the operating costs of the high-speed rail, the total transportation revenue of the high-speed rail is not enough to pay the loan interest for the construction of the high-speed rail.
(translated from Chinese via Google Translate)
He goes on to discuss some key financial figures from the 2016 annual report for the state-owned China Railway Corporation (now called China Railway Group, “China Railway”) which runs most of China’s freight network and the entire passenger network including HSR and conventional rail.
Year-end debt balance: ¥4.72 trillion, of which ¥3.3 trillion (70%) is attributable to HSR
Passenger revenue: ¥282 billion
Interest attribitable to HSR at an estimated 4.75% interest rate: ¥157 billion
As all data is not available, Zhao makes several key estimates. He splits passenger revenue between HSR and conventional, estimating the HSR portion to be about 50% of the passenger revenue, or ~¥141 billion. He attributes 70% of China Railway’s debt to HSR based on construction costs for track and rolling stock. Using an estimated interest rate, he calculates the interest expense attributable to the HSR debt.
Ultimately, he concludes that passenger revenue attributable to HSR (¥140 billion) is not enough to even cover the estimated interest on loans (¥157 billion) used to build the network.
I am familiar with China Railway’s financials, having done a deep dive on its financials back in 2018. Interestingly, as China Railways is one of the largest public bond issuers in the country, its financials are released on a quarterly basis. While they are not that detailed, they do provide insight into the financial situation of the state-owned enterprise.
Response #1: We need to use more accurate, up-to-date numbers and make better estimates
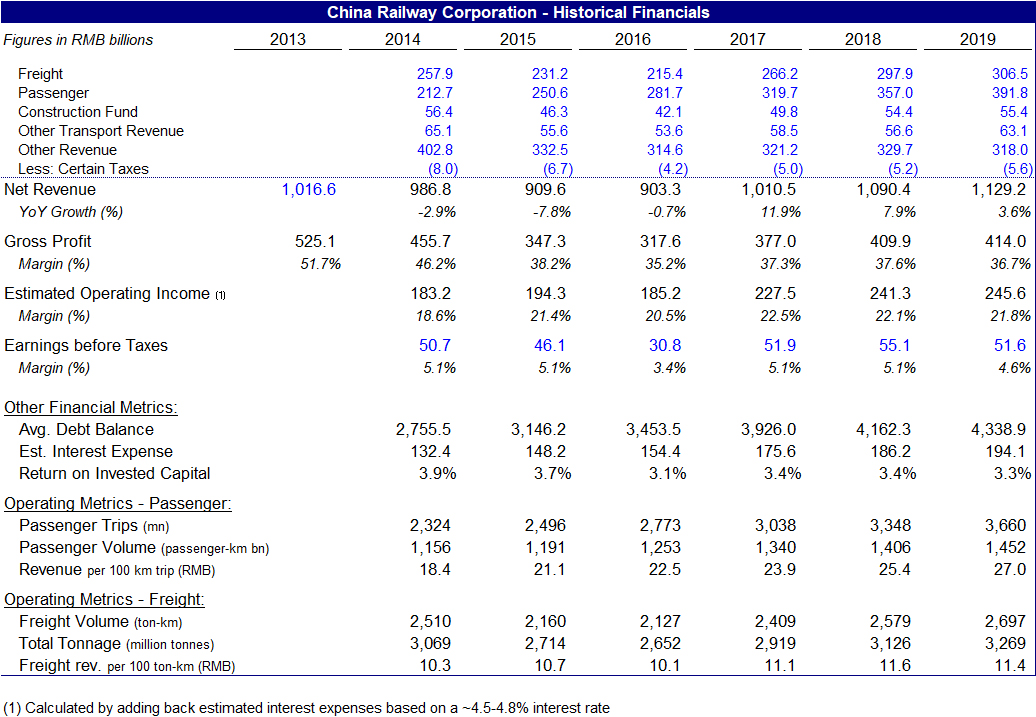
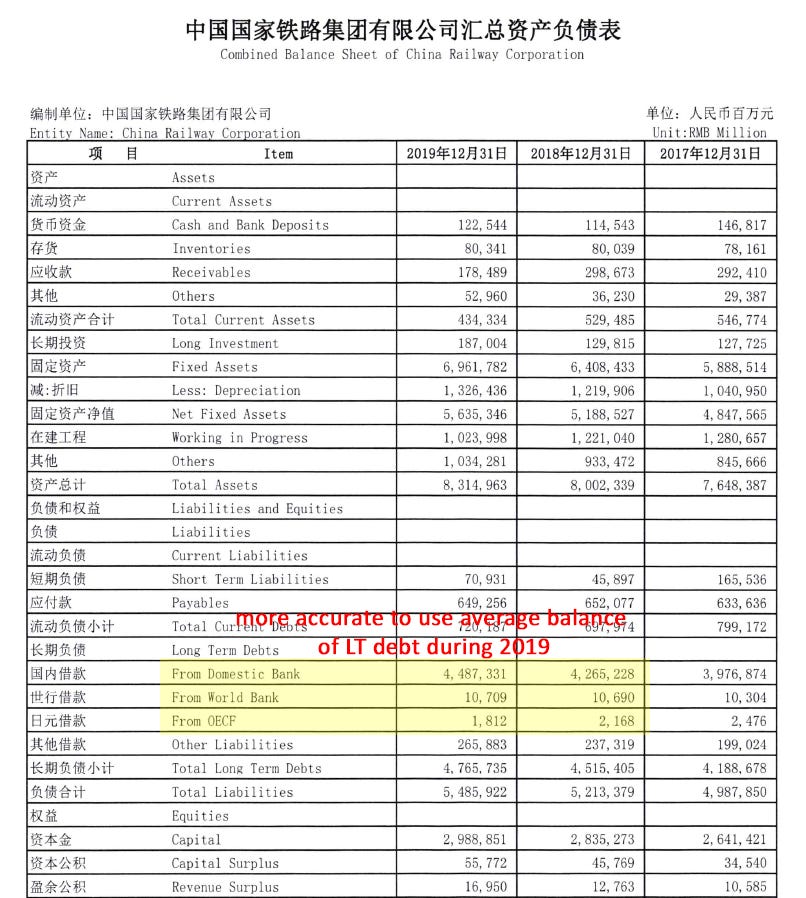
The first observation is that we should be using more up-to-date numbers. Zhao wrote his essay in 2019 but was still referring to financial figures from 2016. In a fast-growing industry, three years is an eternity. Here are the numbers for 20191:
Average debt balance: ¥4.3 trillion (all of which, for the purposes of this exercise, I will attribute to HSR)
Passenger revenue: ¥392 billion
Estimated interest at a 4.5% interest rate: ¥194 billion
There are some differences in the figures that I am using.
First, for his total debt figure, Zhao is actually using “Total Liabilities”. This is incorrect. Total liabilities includes line items like “Payables” (¥626 billion at the end of 2016) where the company does not pay interest.
Second, Zhao uses the year-end balance. However, interest is calculated on the balance throughout the year, and for a company that has a growing debt balance, the average debt balance throughout the year will be lower than the year-end balance.
Correcting these two technical errors, using his methodology Zhao is over-stating the debt balance — and correspondingly, the interest expense — by approximately 37% on the 2016 numbers.
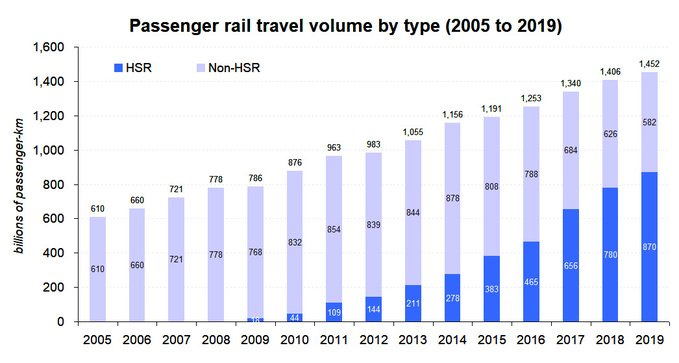
For 2019, I estimated that ~83% of passenger revenue (¥323 billion) was attributable to HSR. Naturally this percentage had risen given the rapid growth of HSR relative to conventional rail, but my estimate for 2016 (74% or ¥208 billion) was also higher than Zhao’s (50% or ¥141 billion).
My estimate is based on the observation that HSR ticket prices tend to be about three times more expensive (per km traveled) than conventional rail. The World Bank had provided estimates of average HSR trip length in a 2019 report, which can be used to estimate the total number of HSR km traveled.
Our interest rate estimates are roughly the same. Zhao estimates 4.75% for 2016 and I estimated 4.5% in 2019. Interest rates had generally fallen in China over that period. Mine was based on a weighted average of all of China Railway’s public bonds, which account for approximately 40-45% of total debt.
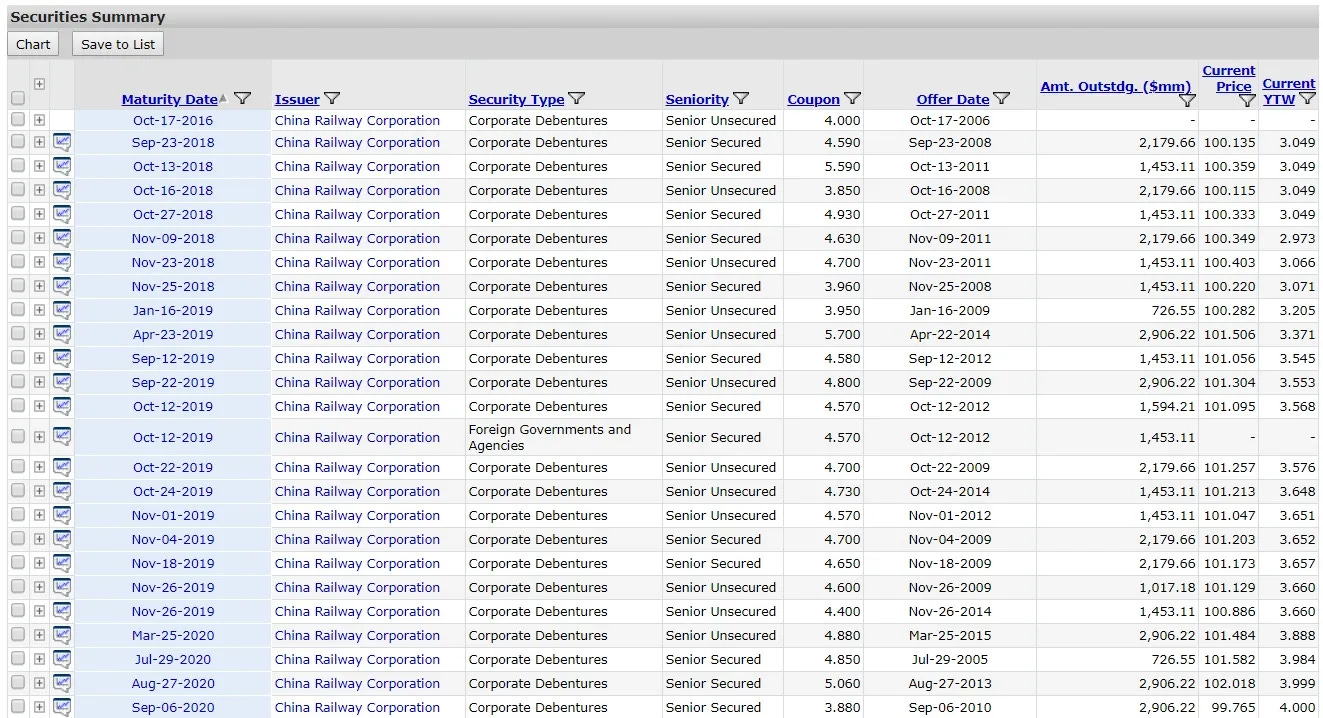
Typical financing for China HSR projects uses a combination of secured and unsecured bonds issued by China Railway at the holding company level and secured project-level loans from an issuer like the China Development Bank (as well as equity from local partners). The World Bank also contributed financing to some early HSR projects which gives us insight into the financing structures through reports like this.
Typically secured, project-level loans have lower interest rates than corporate bonds at the holding company level, so the 4.5% interest rate estimate is very likely conservative — the actual, blended rate could be much lower. But for the purposes of this exercise, I am going with the higher estimate.
Additionally, I am attributing all of China Railway’s debt to HSR - another conservative assumption.
Taken altogether, in 2019 revenue from HSR passengers (¥323 billion) comfortably exceeded the total interest paid by China Railway (¥194 billion) by a 66% margin.
Response #2: China’s HSR is young and still in the early stages of the “J-Curve”
So what changed from Zhao’s analysis based on 2016 numbers to mine based on 2019?
First, Zhao was over-stating debt — and correspondingly, estimated interest — by more than a third.
But more significantly, HSR ridership and revenue had grown more than 50% from 2016 to 2019.
This actually highlights to key issue with Zhao’s analysis apart from the more technical mistakes that he made. Chinese HSR is in rapid growth phase and revenues are increasing significantly faster than incremental debt. It exhibits classic “J-curve” effects.
A J-curve is a trend that starts with a sharp drop but is followed by a dramatic rise in the outer years. It is particularly applicable for investments in long-lived assets that have high upfront costs and will be put in service for decades — like high-speed rail.
When a new rail line opens, it does not achieve full utilization right away. Indeed, if we look at Japan’s Shinkansen high-speed rail system it took more than 40 years for the original Tokaido line to reach peak ridership. The weighted average age of a kilometer of HSR track in China in 2019 was less than five years.
Response #3: Passenger revenue (ticket sales) does not capture the full value created by a public transportation network - we need to take into account foot traffic
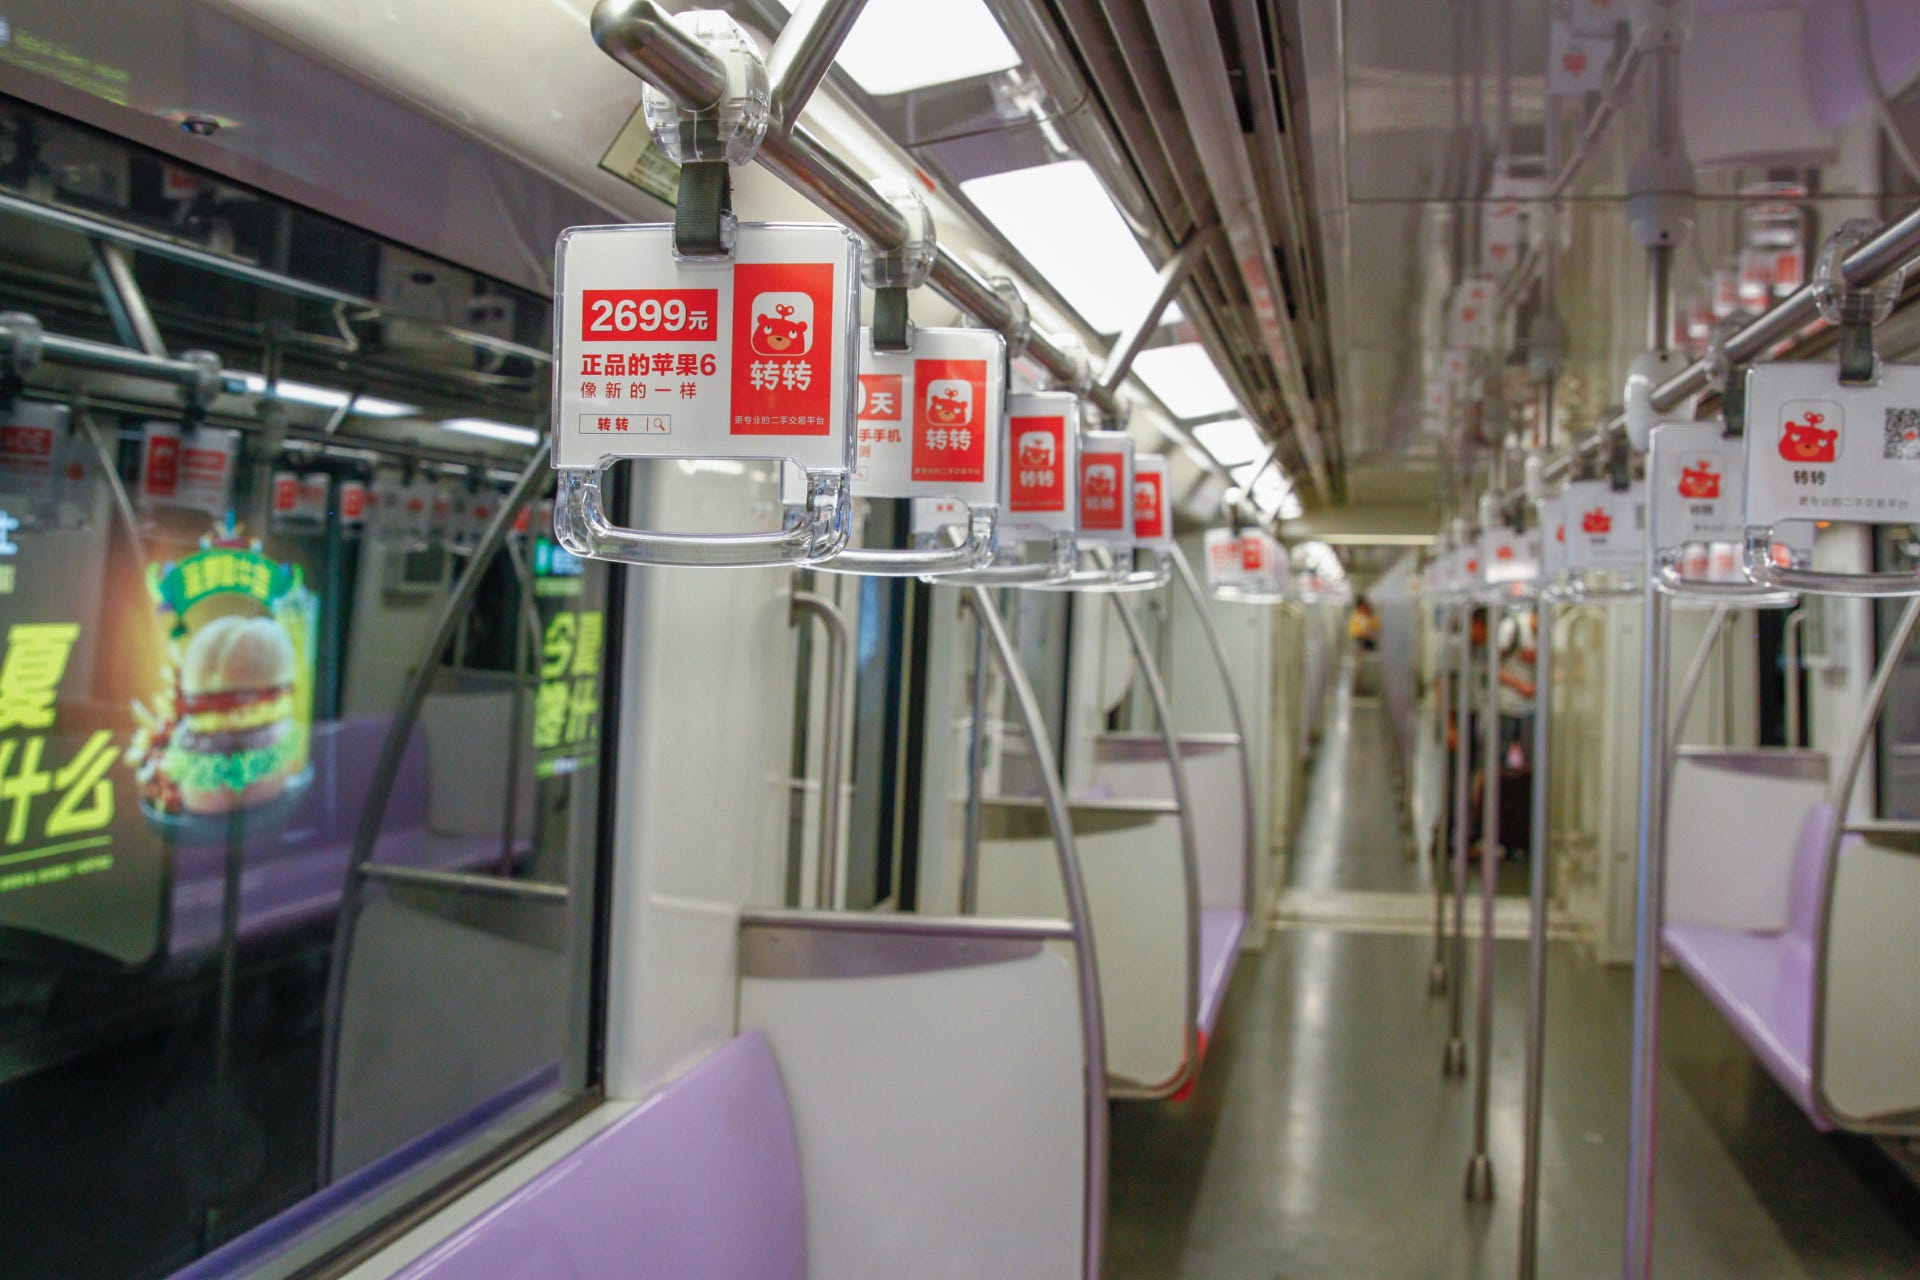
Another major point is that passenger ticket sales do not capture the full value created by the high-speed rail network. There is significant value created by aggregating all of that foot traffic into network hubs and owning a captive audience for the duration of the trip. This translates into real estate-based revenue like commercial rents and advertising and essentially subsidizes ticket sales. China Railway also generates revenue from selling food and snacks on the train.
China Railway’s “passenger” revenue only captures ticket sales. There are additional “other transport revenue” and “other revenue” line item on the income statement that includes revenue from these sources. In 2019, this amounted to ¥381 billion — more than my estimate for HSR revenue itself. While not all of it is attributable to HSR, since HSR generates the majority of foot traffic these days, it certainly deserves a large share.
MTR Corporation in Hong Kong is perhaps the most successful example of a profitable public transportation network and the reason is because at its heart it is really a real estate (and advertising) business.
Response #4: All of the debt should not be attributed to HSR; China Railway leveraged mature freight and conventional rail businesses to fund build-out of HSR
Much of the funding for China’s HSR build-out came from the issuance of bonds by China Railway. These bonds are supported by all of the assets of China Railway, not just the HSR network. China Railway runs most of the freight rail network and all of the legacy conventional passenger network. For most of history, revenue from the freight network outweighed ticket sales from the passenger network (HSR and conventional).
In my financial analysis above, I had (conservatively) attributed all of the debt and interest at China Railway to HSR. But in reality, it is supported by revenue by the entire company, including freight and conventional passenger rail. If we mentally allocate all of the debt to HSR, that means that you have a highly profitable, un-leveraged freight and conventional passenger rail business.
In reality, allocating all or most of the debt to HSR is just a theoretical exercise that does not really make a lot of sense. We should be looking at the debt service capacity of the entire corporation, including the freight and conventional passenger rail business.
If we step back, what really happened here was that China Railway chose to “lever up” its mature freight and conventional passenger rail businesses and take advantage of a relatively low-cost capital sources to fund the build-out of the HSR network. It’s an effective form of financing that keeps the cost of capital low.
Response #5: To account for externalities, public transportation networks need to be evaluated by the overall societal returns, not merely financial returns
Taking an even bigger step back, passenger rail networks should not be solely evaluated on the basis of financial returns, but on total societal returns that take into account externalities like lower pollution and indirect effects like productivity increase through urban agglomeration.
As a public asset, a rail network should not solely focus on maximizing profit or financial return. With a monopoly on long-distance public transportation, China Railway can very easily increase profitability by simply raising ticket prices, but that would eat away into the societal value which is directly proportional to ridership. Optimizing for ridership is just as important (or perhaps even more important, depending on the size of the positive externalities) as financial return.
These externalities are harder to measure but that does not mean they are insignificant. In 2021, Macro Polo released its analysis of China’s HSR network, including in-depth analysis trying to more precisely measure the impact of these externalities, both positive and negative.
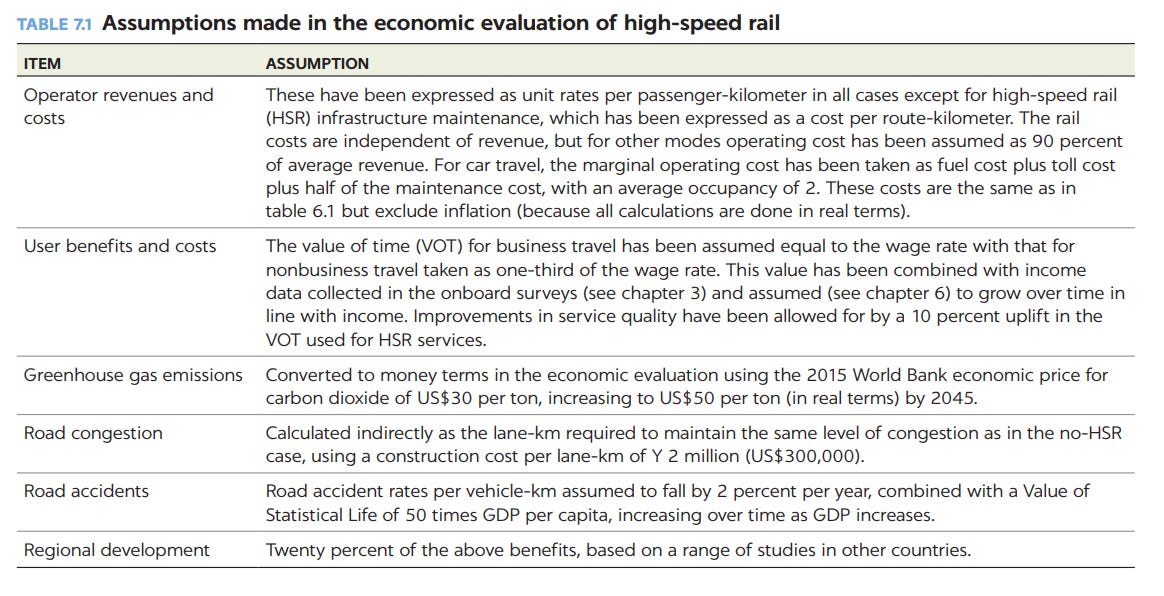
The World Bank report also directly factored in environmental factors and other externalities into their economic analysis on four specific projects they helped finance, with economic rates of return ranging from 8% for Jilin-Hunchun to 18% for Guiyang-Guangzhou.
China Railway does not target generating any return on equity: ticket prices and freight tariffs are set to generate enough capital to provide a financial rate of return to debtholders: interest paid to banks on loans and bondholders on the bonds. From 2010 to 2019, China Railway generated cumulative profit before taxes of ¥549 billion and nearly all of it was used to cover taxes paid back to the state. The non-financial externalities effectively count as the returns to society.
(2) Low utilization outside of a few main lines
Zhao’s second main point is that outside of a few core lines (e.g. Beijing-Shanghai), the rest of the network was “largely idle”:
At present, except for the high-speed rail transport capacity on the Beijing-Shanghai and Beijing-Guangzhou corridors, which are well utilized, the transport capacity of other high-speed rail projects is largely idle, resulting in serious losses.
(translated from Chinese via Google Translate)
He cites the Lanzhou-Xinjiang line as the main example of one of these under-utilized lines:
For example, the Lanzhou-Xinjiang high-speed railway runs only 4 pairs of high-speed trains every day, and its transportation revenue is not even enough to pay for electricity, while the Lanzhou-Xinjiang high-speed railway has the capacity to run more than 160 pairs of high-speed trains every day. The index that can best reflect the utilization efficiency of railway transportation capacity is transportation density, that is, the average annual transportation turnover per kilometer of railway (the ability of each kilometer of railway to generate annual transportation revenue).
Zhao goes on to cite utilization metrics …
In 2015, the Beijing-Shanghai high-speed railway with the highest traffic density among China's high-speed rails had a traffic density of about 48 million person-km/km, and the lowest Lanxin [Lanzhou-Xinjiang] high-speed rail was only about 2.3 million person-km/km. The average national high-speed rail traffic density was 17 million person-km/km or so.
… noting that even the most-utilized line does not compare with the Tokaido Shinkansen line in Japan:
Even the Beijing-Shanghai high-speed railway with the highest transportation density still has a big gap with the world’s highest density of 90 million people per kilometer on the Tokaido Shinkansen in Japan, because about 55% of the population of Japan is gathered on this 500-kilometer passage , there are more than 4,000 kilometers of urban rail transit for the Tokaido Shinkansen to collect and distribute passenger flows. The average traffic density of Japan’s high-speed rail is 34 million person-km/km, which is twice the average traffic density of China's high-speed rail.
(translated from Chinese via Google Translate)
This is a very valid concern. Utilization is by far the most important metric in determining the success of long-lived high upfront cost inastructure projects like high-speed rail.
It drives not only the financial returns but also the non-financial societal returns. For example, reduction in pollution is directly proportional to the number of riders choosing to use HSR instead of a higher-polluting form of transport (like air travel or passenger vehicles).
However, Zhao’s supporting empirical analysis is dated and the logic flawed.
Response #1: Again, we need to use up-to-date data; Zhao is using old utilization data from 2015 that just happened to coincide with the bottoming out in HSR network utilization
In his utilization analysis, Zhao primarily refers to utilization data from 2015. In a similar theme to his financial analysis, Zhao is referring to really old data — for a sector that is growing and moving so quickly.
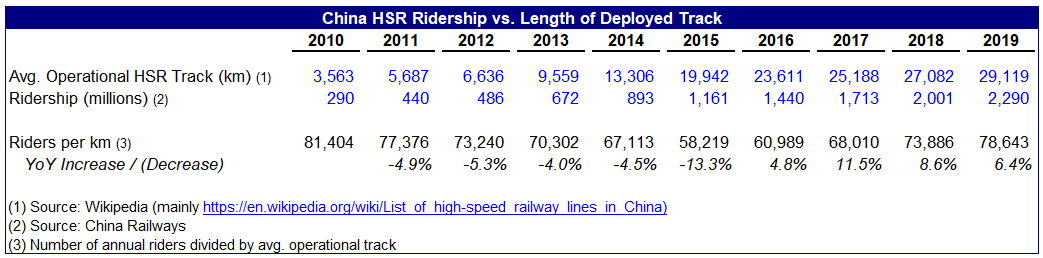
Once we use more current data, we can see that 2015 was the nadir for utilization. In the table below we can see how the growth in average operational track outpaced the growth of ridership through 2015 before starting to reverse in 2016.
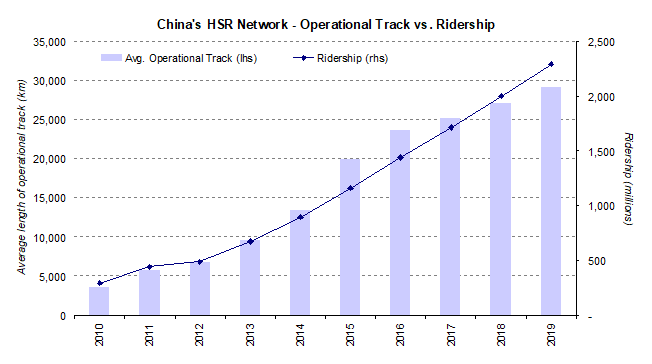
From 2010 to 2019, the average length of operational track increased by 46% while annual ridership increased by 97%.
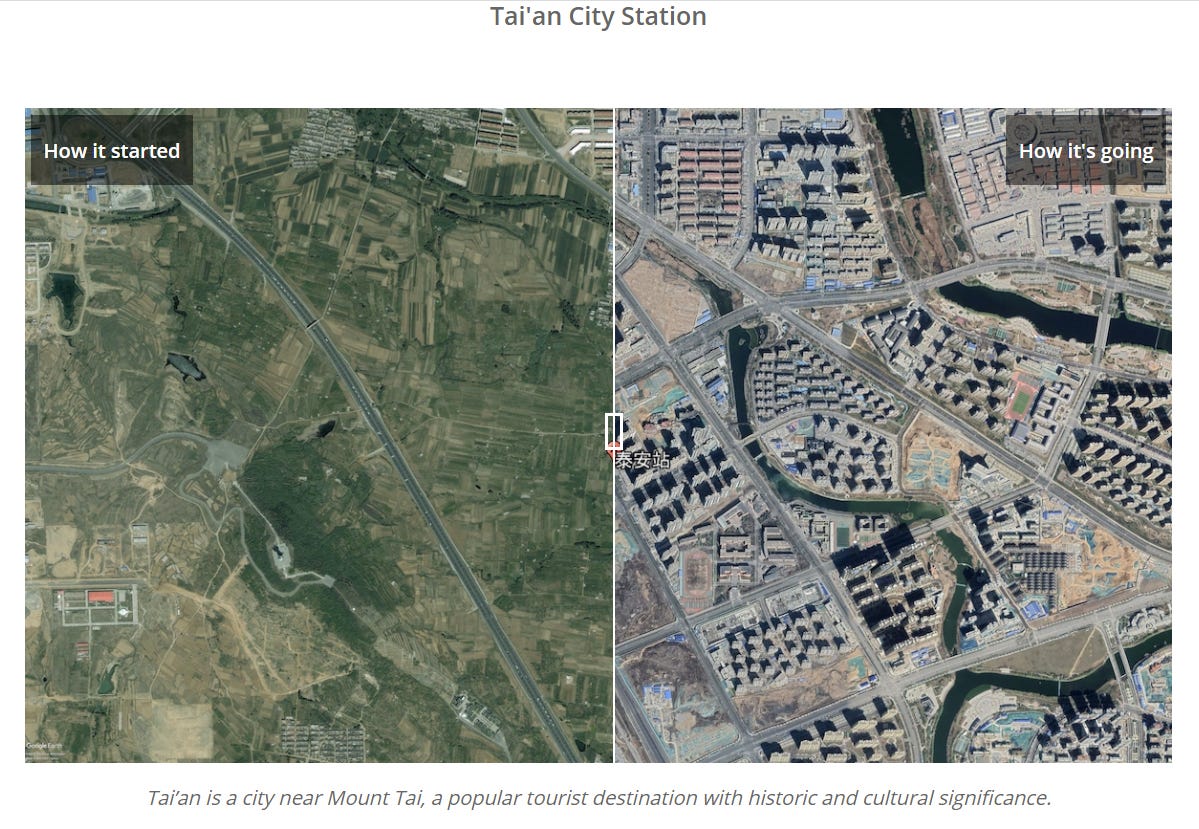
Part of this was the aforementioned J-Curve effect. It takes years for passengers and urban neighborhoods to adjust to new HSR infratructure. It takes decades to reach peak utilization. Macro Polo did a good job of showing this in their analysis in its side-by-side analysis of Tai’an Station:
Response #2: Lanzhou-Xinjiang is not representative of the network; China’s overall network utilization compares favorably to other HSR networks around the world
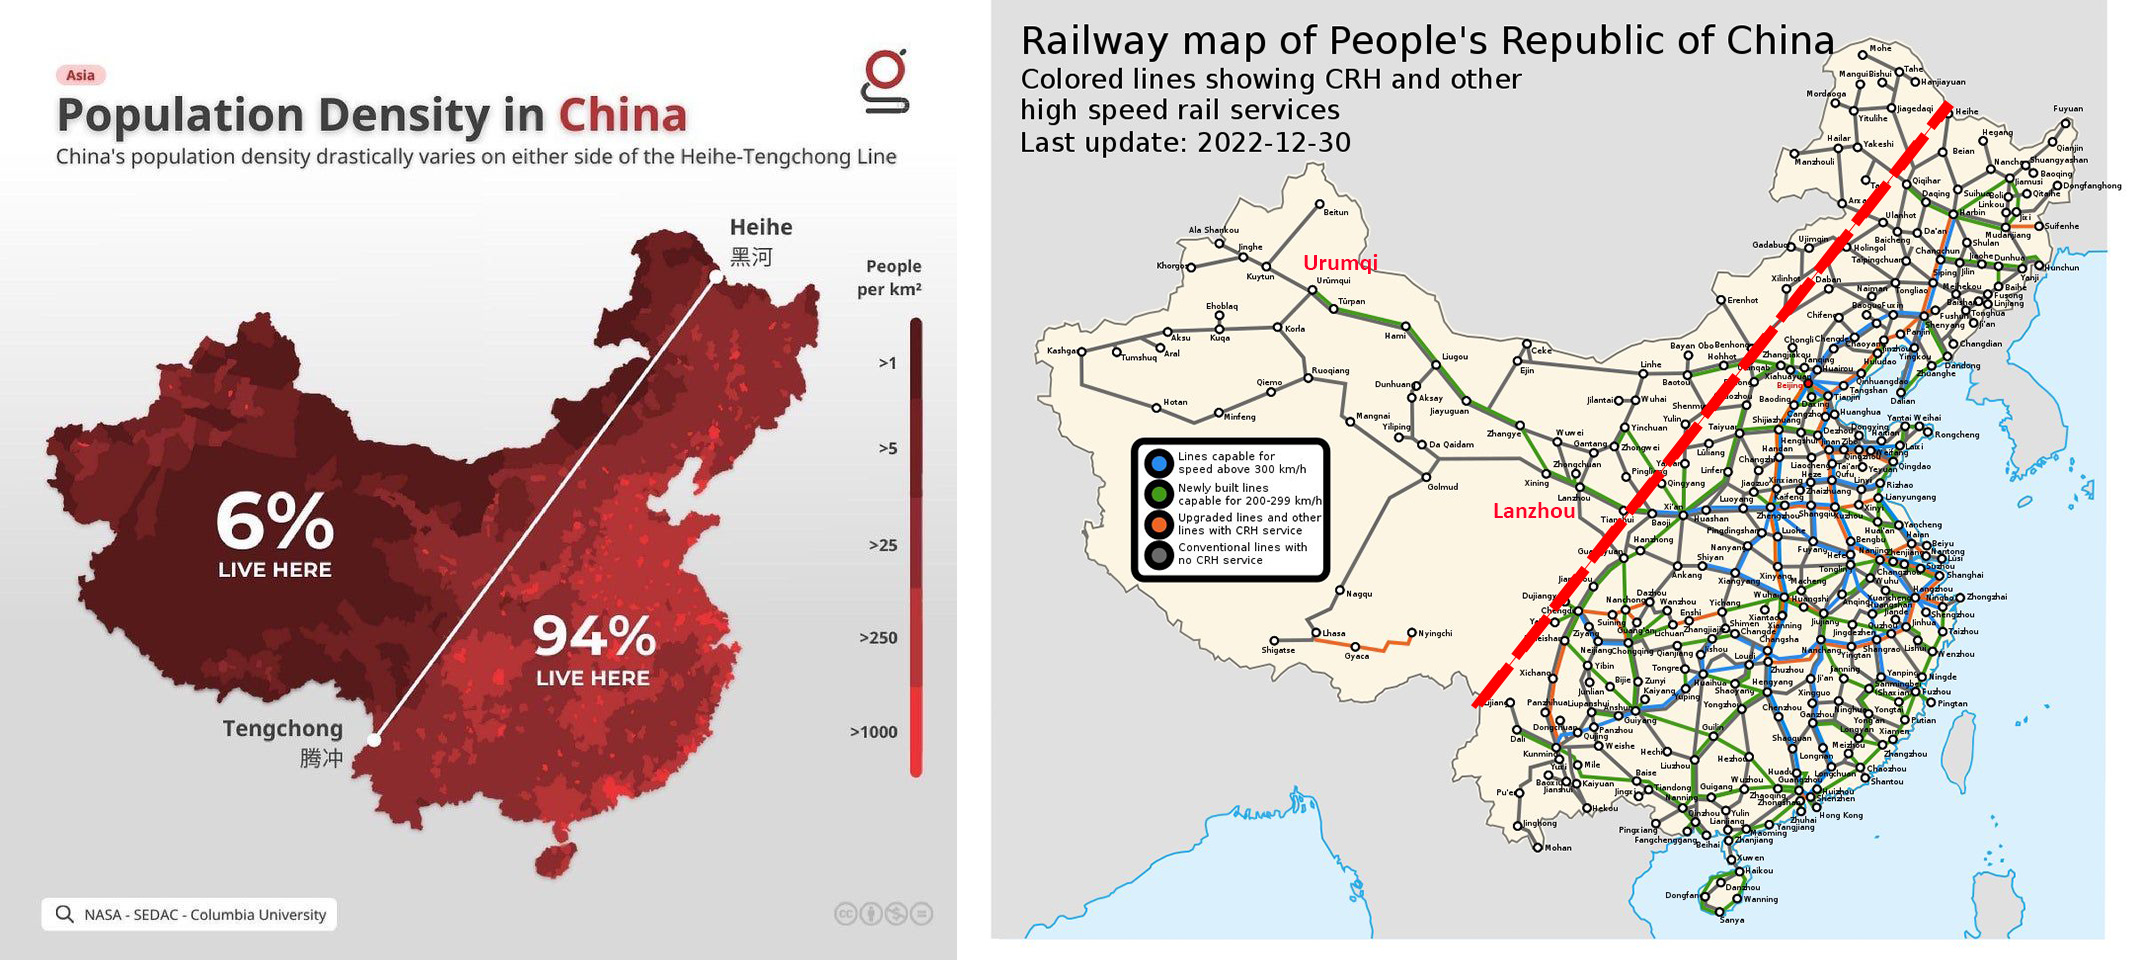
In particular, 2015 was a special year because the first phase of the Lanzhou-Xinjiang line had just been completed in December 2014. It was a 1,777-km line stretching from Lanzhou at the western edge of the Yellow River plain to Urumqi, the capital city of Xinjiang. It passed through a very sparsely populated area. While it cut travel time from 20 hours to 12 hours and freed capacity on an older conventional track for freight, ridership is very low with only 4 trains running per day.
From a financial perspective, the Lanzhou-Xinjiang line is a complete write-off, as I discussed in 2020. However, Lanzhou-Xinjiang was very much an exception to the rule and absolutely not representative of the rest of the network.
In a recent tweet thread, I highlighted how the Lanzhou-Xinjiang line was the only major line sitting west of the “Heihe-Tengchong line”. 94% of China’s population lives east of the line and that area has a population density (870 per sq. mi.) that is higher than Japan’s (759) and more than three times higher than France (260).
Why focus on an extreme example when we can simply evaluate ridership and utilization of China’s entire network (in 2019, not 2015) compared to other HSR networks around the world? This factors in all of the lines, including the good (e.g. Beijing-Shanghai) and the bad (e.g. Lanzhou-Xinjiang).
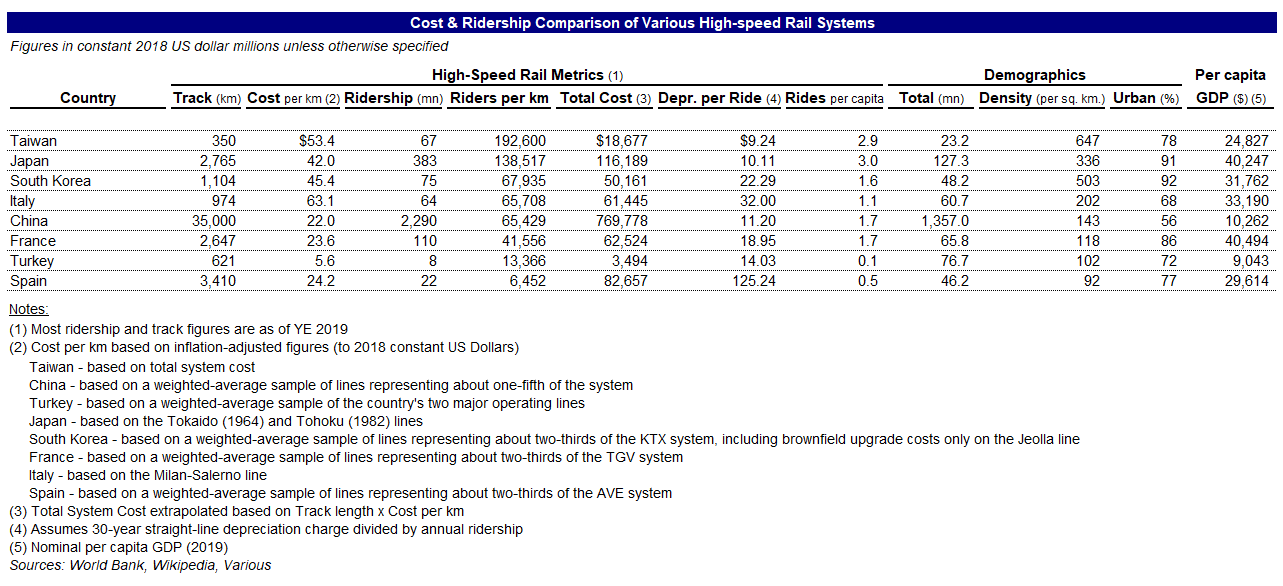
From a utilization perspective, represented here as “riders per km of operational track”, China is about middle-of-the-pack. As Zhao points out, China is well below Japan but ahead of other networks like France. When you factor in construction cost (represented above as “depreciation per ride”), China comes out higher because its construction costs were generally lower.
Lastly, is it really fair to compare China’s utilization to Japan’s? As mentioned earlier, it took more than four decades for Japan’s Tokaido line (opened in 1964) to reach peak utilization (in 2007). The weighted-average age of China’s HSR system is five years — China’s HSR network needs more time to ride the J-Curve before such comparisons become more meaningful.
(3) Opportunity cost of under-investing in the freight network
Zhao makes the argument that over-investment in HSR has taken resources away from investing in the freight rail network … leading to a higher proportion of goods being transported by trucks.
Large-scale high-speed rail construction has led to a rapid decline in the market share of China's railway freight turnover (excluding ocean transportation) from 50% in 2005, at a rate of 3% per year, to only 17.1% in 2016. While the freight volume of other modes of transportation is increasing, the market share of road freight turnover has risen rapidly to 49% in 2016. Resources are always limited, and a large amount of investment in high-speed railway construction will inevitably reduce the construction of ordinary railways, which has led to a serious deterioration of China's transportation structure.
Large-scale high-speed rail construction has seriously distorted China's transportation structure. Because the railway freight capacity cannot meet the demand, China uses a large number of cars to transport basic raw materials such as coal, and uses scarce oil resources to transport cheap coal resources, which greatly increases logistics costs and seriously reduces the resource allocation efficiency of the national economy as a whole.
(translated from Chinese via Google Translate)
He argues that, adjusted for PPP, the cost of freight is higher in the U.S.:
Based on the data from 2009 to 2013 based on purchasing power parity, the World Bank estimates that the price level of China’s railway freight is 1.3 times that of the United States.
(translated from Chinese via Google Translate)
He also benchmarks the relative contribution of rail freight to others, particularly trucks, and believes rail should be used more on a relative basis:
China’s port container throughput ranks first in the world, accounting for more than 40% of the global port container throughput, but 84% of port container collection and distribution are undertaken by road transport. In 2017, the container throughput of ports above designated size in the country was 238 million TEUs, while the sea-rail combined transport volume was 3.48 million TEUs, accounting for only 1.47% of the container throughput of ports above designated size. The advantages of railways in long-distance transportation cannot be fully utilized , seriously reducing the efficiency of cargo transportation. In the United States, the container sea-rail combined transport ratio is as high as 40%, and in Japan, it is 38%.
(translated from Chinese via Google Translate)
I would also like to give a shout out to Patrick Chovanec who first introduced me to this concept back in 2011 in a post on his blog entitled “China’s High-Speed Rail Dilemma”. Like Zhao, Chovanec very much focuses on the comparison with the American freight network:
While America’s passenger rail services leave something to be desired, its freight rail system is the best in the world. Inland Chinese cities like Chengdu or Lanzhou are really no more remote from global markets than Chicago or Denver; the difference is a robust and efficient logistics network. With container terminals, rail yards, and modern storage facilities in place, more industries would find it plausible to locate in China’s interior, alleviating the need for workers to travel so far from home to find a job.
At the time I had responded to it (re-posted here) and I think most points remain relevant today. While the thesis was interesting, ultimately it did not factor in some of the differences between the U.S. and China that made prioritizing passenger rail the right decision. We now have the benefit of the last dozen years of hindsight and the data to show why.
Response #1: The majority of the rail freight network is used for coal — prioritizing the rail freight network really means prioritizing domestic coal
Let’s remember what rail freight is really used for — we are not talking about Amazon consumer packages and Fedex documents. It is typically used for heavy, relatively inexpensive “bulk” stuff that is not particularly time-sensitive: it’s really about commodities — and in China we are mostly talking about coal.
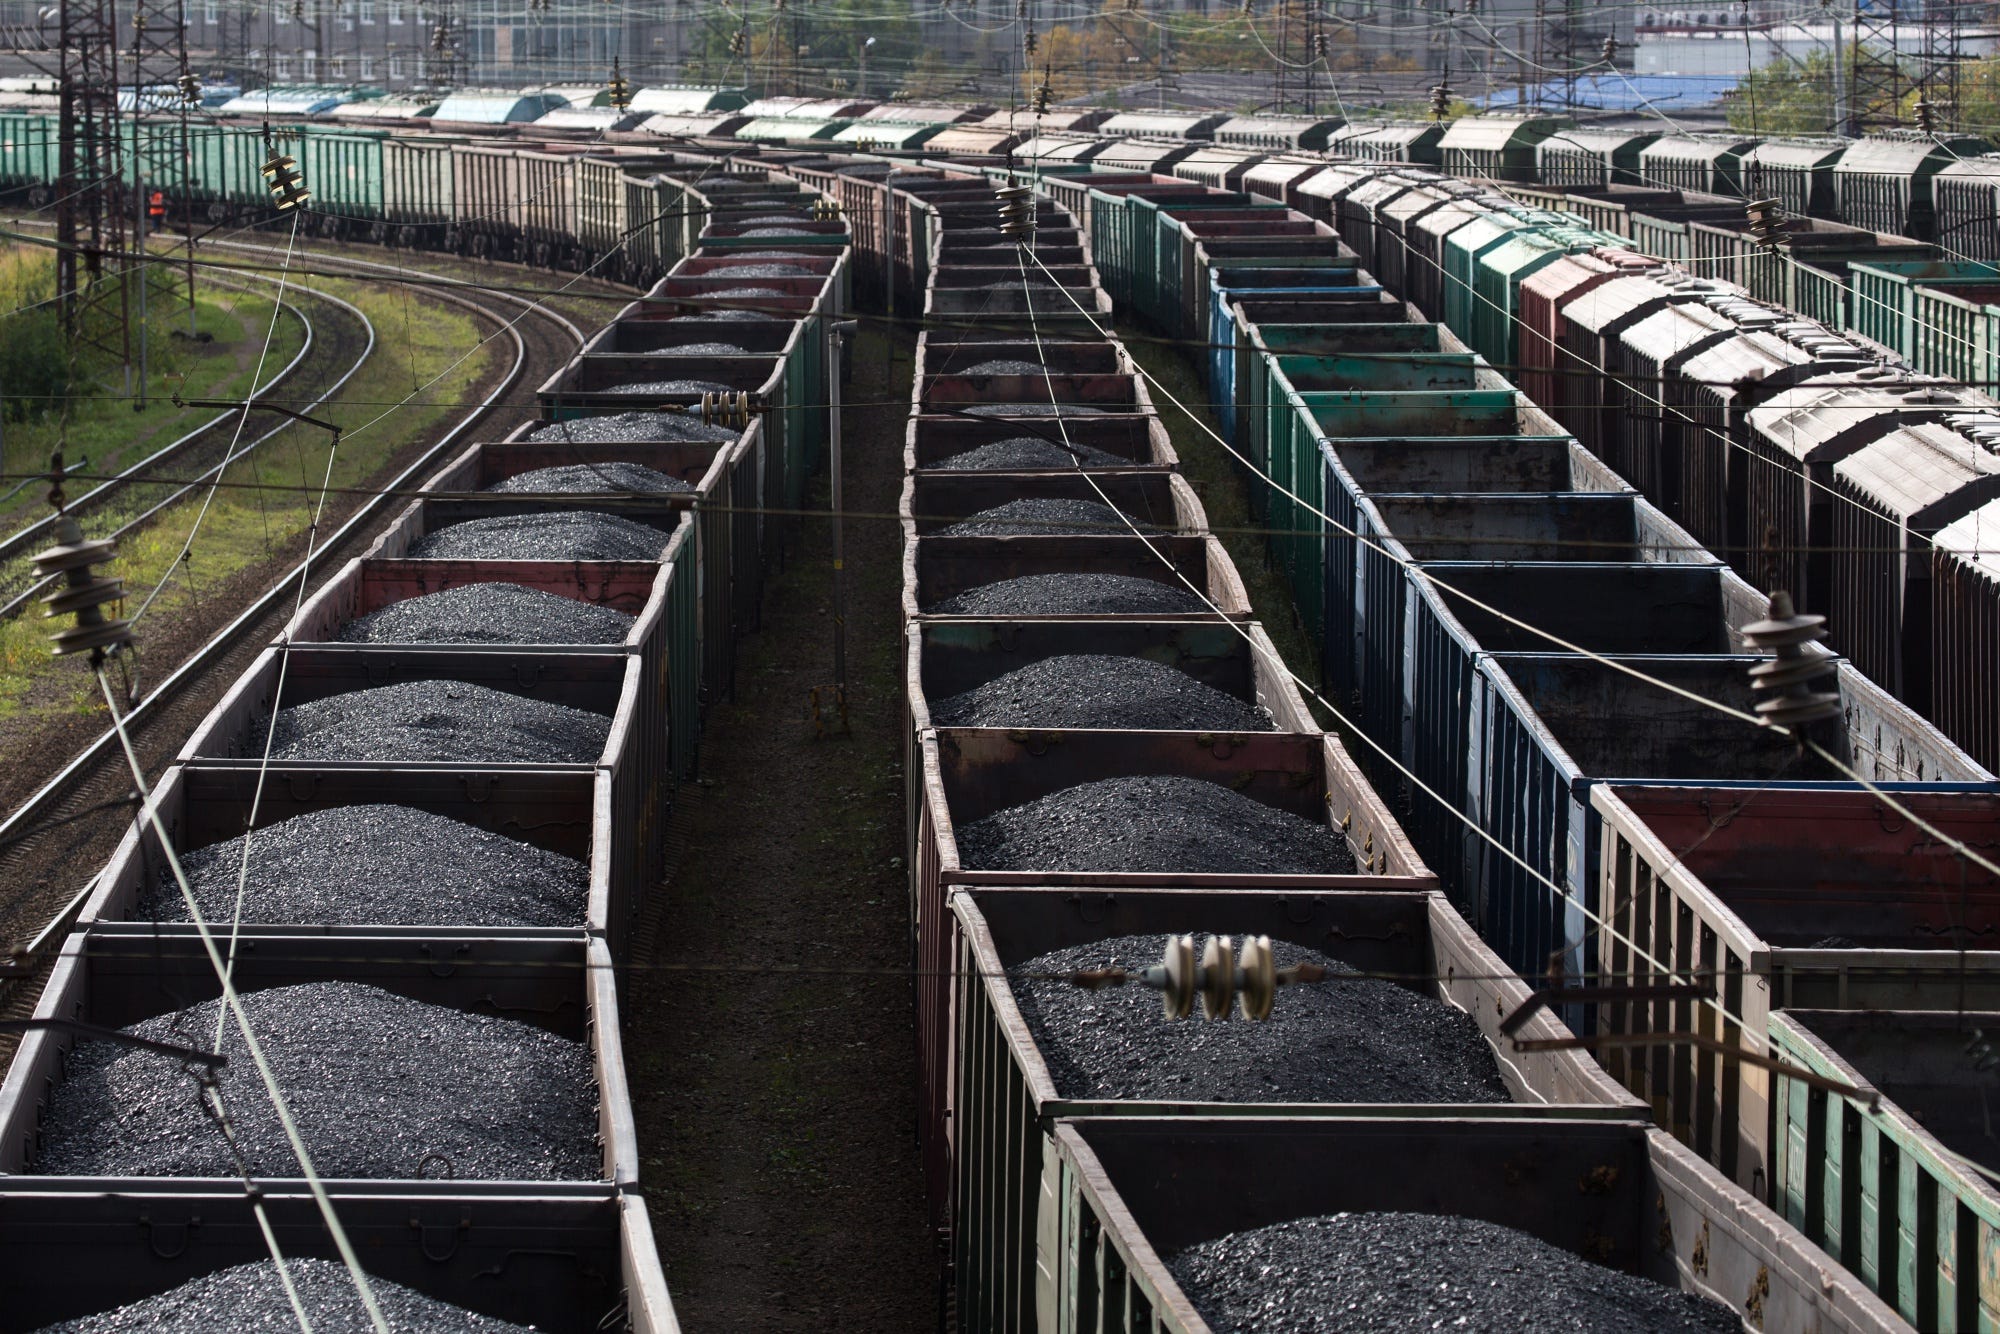
One of my last projects in Hong Kong was preparing China Shenhua Energy’s IPO in 2005. It was one of the largest coal miners in the world, ran its own (coal-fired) electricity generation network and also owned one of the largest rail freight networks, dedicated to transporting coal. Coal and trains go hand in hand.
More than half of the rail freight network by tonnage is used to transport coal. Another one-fifth of tonnage is for ores and minerals. Agricultural products like grain and fertilizer are less than 3% of tonnage each. Container cargo was only 5% of tonnage.
In China, prioritizing the freight network really meant prioritizing coal and other construction-centric commodities like ores and minerals. But sitting there in the early/mid-2010s, would that have been the right decision? Hindsight has shown us that the answer was an emphatic “no”.
While growth of coal and construction-centric commodities like iron ore grew rapidly in the 2000s, the long-term (measured in decades) strategic direction was clearly to transition the economy away from coal usage. While it would still continue to grow for a while longer, the fast-growth days of domestic Chinese coal were fading. Policymakers were already thinking about solar and other renewable energy sources in the mid-2000s. There was the rapid rise in imported seaborne coal from places like Indonesia and Australia as policymakers looked to shut down less efficient (and less safe) smaller coal producers.
Domestic production of coal, the key driver of the rail freight network, essentially plateaued in 2011 after almost tripling over the previous decade:
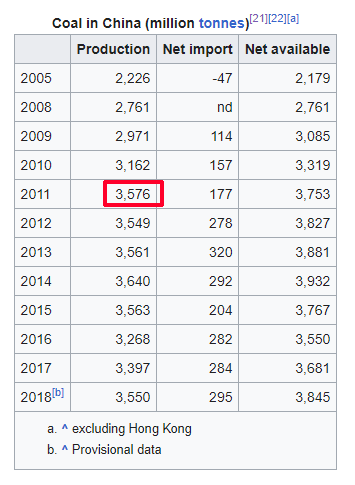
China’s 12th 5-year Plan (covering 2011-2015) called out the need to transition away from energy-intensive activities which given the reality of China’s energy industry, meant using lots of coal for both electricity and construction. By 2014, there was a noticeable slowdown in the growth of these erstwhile fast-growing economic activities and — with China being the world’s largest consumer of most commodities — led to a commodities bust. Global commodities prices plunged 38% between June 2014 and February 2015 and coal usage fell for the first time in decades in China.
Just think: If you knew that the main customer for your product was going to start declining in four to five years, and you were in charge of the decision to invest in a project with an expected service life measured in decades (if not centuries), would you have put money into it?2
Response #2: China’s passenger network was extremely under-supplied — conventional rail continued to grow for another seven years until passengers started moving en masse to HSR.
While history has shown that it made little sense to invest heavily in the freight network, hindsight has also proven that the conventional passenger network was in dire need of investment.
We can see this very clearly in the numbers. Following the opening of the first HSR line in 2007, ridership on conventional train network continued to grow until 2014.

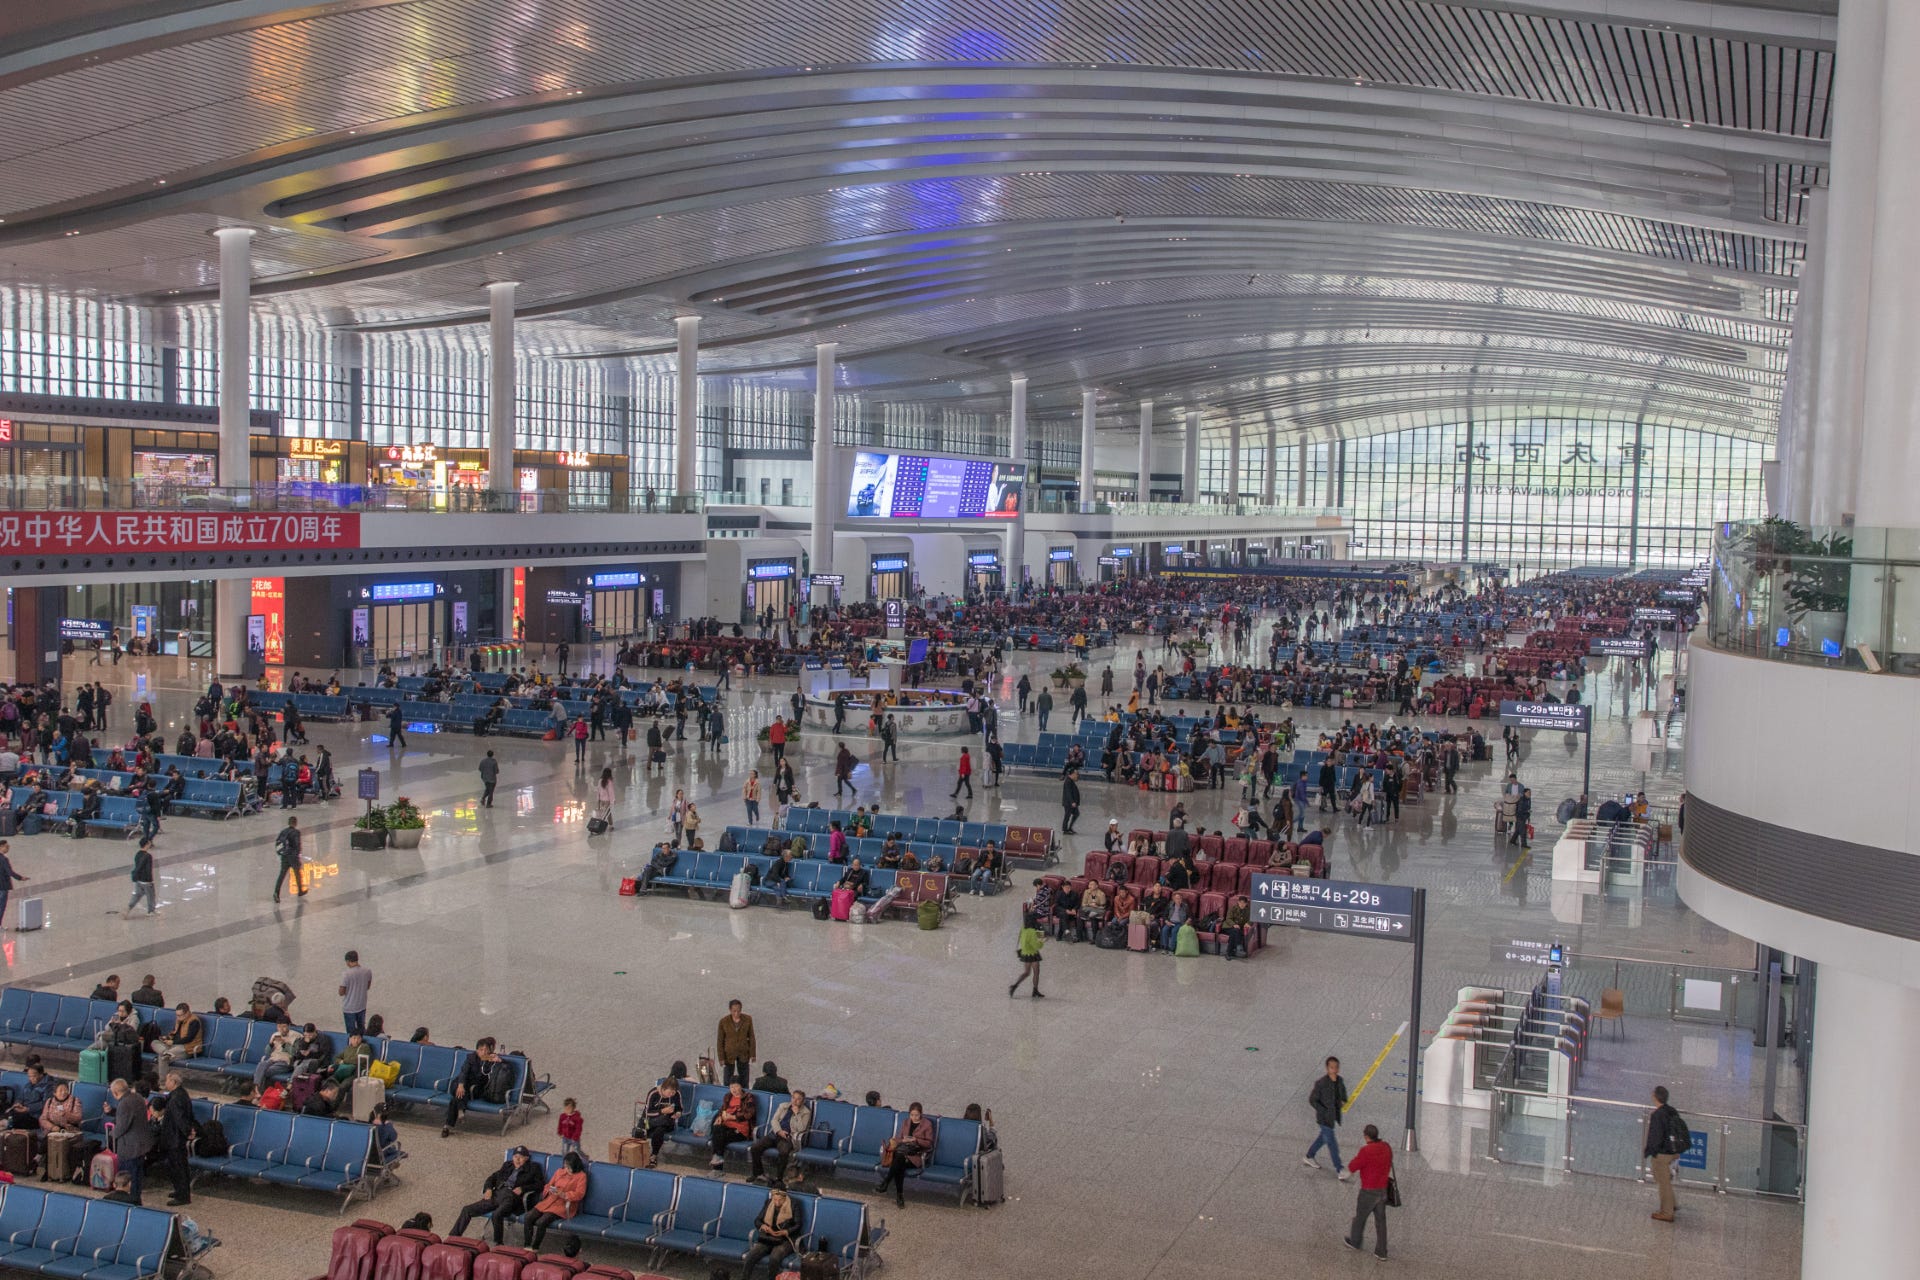
I am old enough to remember those apocalyptic scenes at train stations during the New Year and mid-Autumn festivals. Chinese travelers, including migrant laborers trying to take advantage of the two times per year they got to visit their families, would overwhelm train stations in a desperate attempt to just purchase tickets. And the prize for securing those tickets would often be grueling 10+ hour or even multi-day trips to get back to their villages.
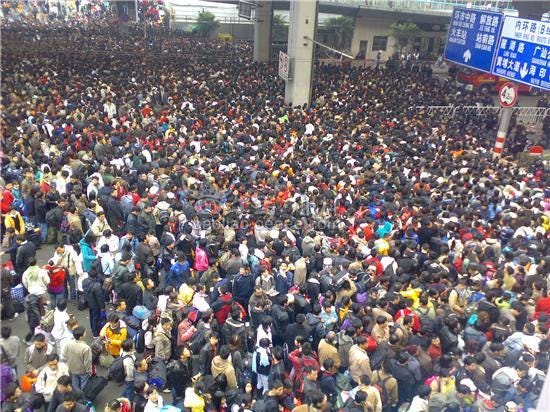
It certainly still gets crowded, but nothing like it was 15 years ago. And even when it gets crowded, mobile ticketing and new train stations make travel an order-of-magnitude more bearable.
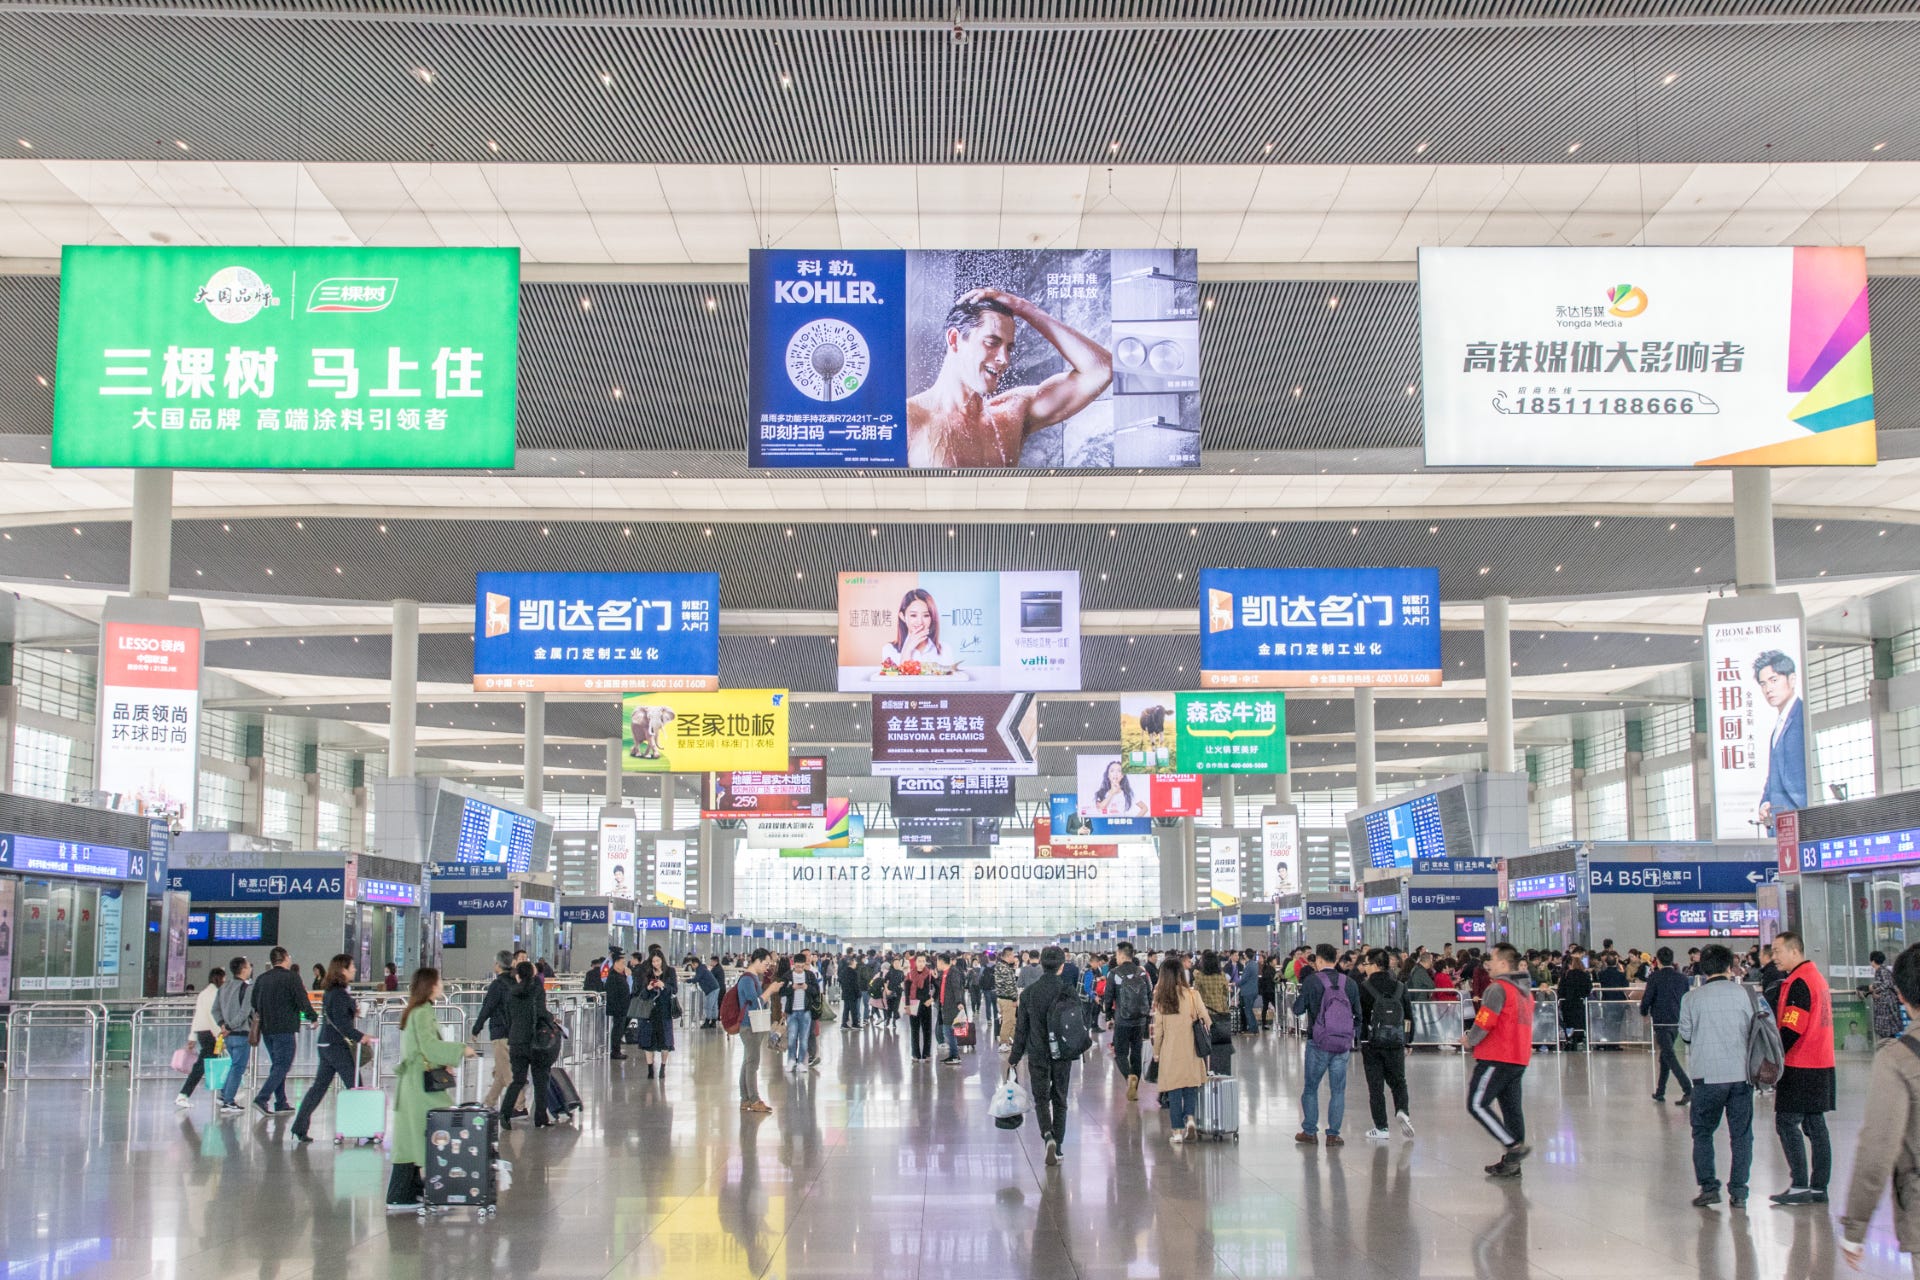
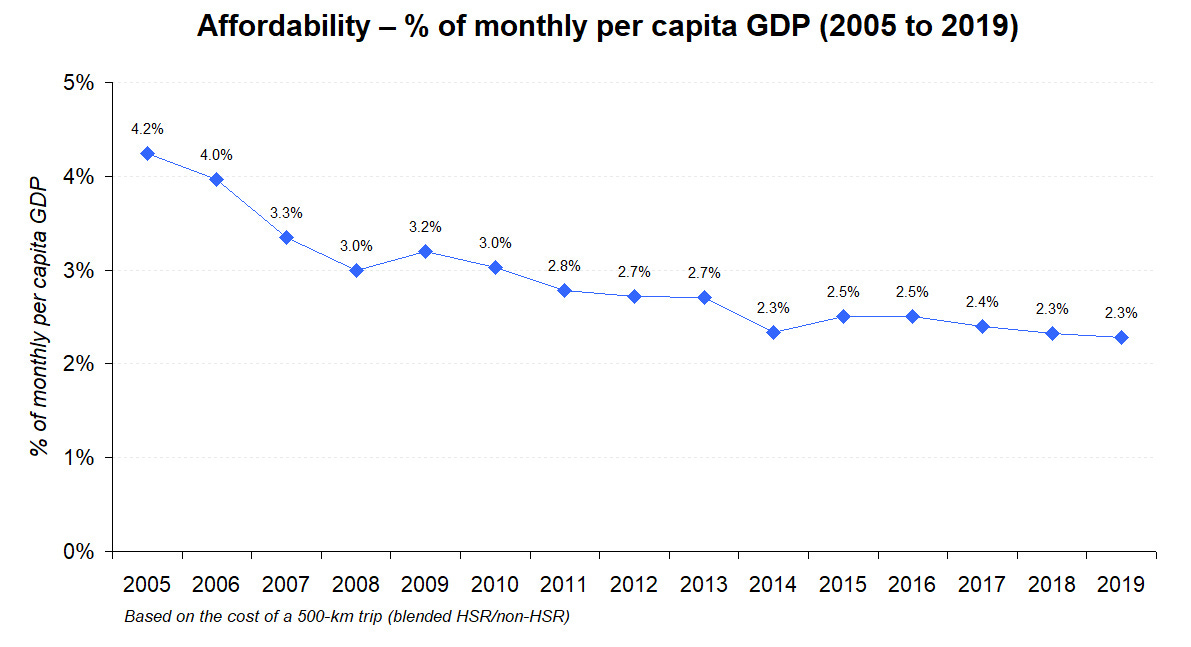
By the mid-2010s, with China’s HSR network starting to reach critical mass, HSR travel began to really supplant travel via conventional trains for many routes. One factor here was simply increasing affordability of high-speed trains.
Rising disposable incomes had started to allow even thrifty migrant laborers to start choosing HSR travel over conventional rail. In 2018, I wrote about how more and more migrant laborers were using HSR trains.
Response #3: China is not the U.S. and significant differences change the passenger vs. freight rail cost-benefit equation
Both Zhao and Chovanec compare China to the United States when it comes to their freight networks. Here Zhao cites how China’s freight market is much lower than China’s and that China should aspire to reach U.S. levels:
First, there must be a bottom-line thinking for the adjustment of the transportation structure. In 2017, the market share of China's railway freight turnover (excluding ocean transportation) was only 17.5%. The United States is the most developed country in road transportation in the world, but its market share of railway freight turnover has been around 40%. The supply-side structural reform of China's transportation structure should bring the market share of rail freight turnover close to or at the level of the United States.
Similarly, here Chovanec advocates for China to be more like the U.S.:
The argument I make — in abbreviated form — in my CER article is that rather than trying to divert passenger traffic to high-speed rail, China should focus on the (far less glamorous) task of improving and expanding its intermodal freight system — using the U.S., in part at least, as a model. That involves not just laying more conventional track, but also building the support infrastructure to make more efficient use of that track, especially in China’s underpenetrated interior.
Putting aside the reality that domestic coal production was going to peak very soon, these views ignore other substantial differences between the U.S. and China that ultimately change the cost-benefit calculation between passenger and freight.
The United States is one of the world’s largest agricultural exporters. We have built a freight network that is highly optimized to move bulk grains from places like the Great Plains thousands of miles to the container ports to be shipped around the world. Even for our own domestic consumption, our population centers are typically located very far from where our food is grown — you can see this simply by looking at where your fruits and vegetables come from.
At my local Whole Foods, I get my apples from Washington (2,700 miles away) and my oranges from Florida (1,100 miles):

Meanwhile, China is a food importer and generally food is grown a lot closer to population centers — the majority of a Chinese family’s food basket consists of goods that do not need to be transported thousands of miles across the country. When you have to distribute products tens or hundreds of miles instead of thousands, trucks make more sense than rail. This also explains why Chinese families love to shop at wet markets — fresh, local produce is ingrained in the Chinese diet.
Due largely to the significant difference in population density — particularly for the roughly one-third of the country where 94% of Chinese people live (870 per sq. mi. compared to 94 for the U.S.) — it makes more sense for some higher-value consumer goods to travel by rail in the U.S. vs. China. 48% of rail freight in the U.S. consists of “consumer goods and other miscellaneous [non-bulk commodity] products”.
These differences, as well as e-commerce playing a much larger role in the distribution of consumer goods in China (discussed more below), explain why it is quite silly to think that the United States should serve as a model for China to follow as it relates to freight infrastructure. Europe is far better as a model for China and even then it is also quite different.
Response #4: China’s logistics industry has developed significantly the last 15 years, driven by e-commerce — but it wasn’t the rail network that needed investment
In his essay, Zhao continuously hammers home the point that “HSR can only transport people but not goods”. China certainly needed to improve its logistics but focusing on the freight network was the wrong approach.
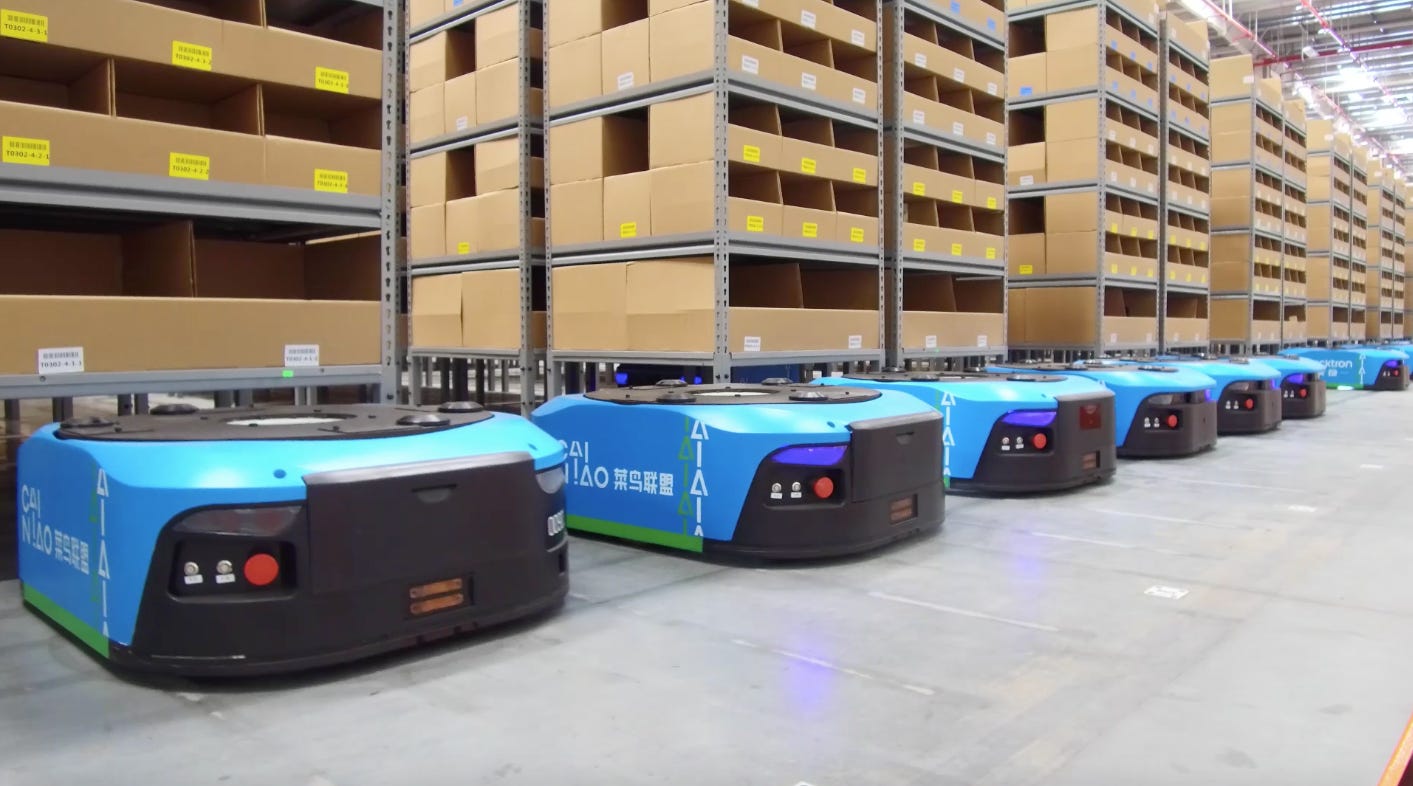
The reality is that logistics in China have improved immensely over the past fifteen years, largely driven by rise of e-commerce. But the investment required to improve the type of logistics required for consumer goods — i.e. higher value items that are very time-sensitive — had nothing to do with the freight rail network.
Instead of investment in more rail track, China’s logistics network needed investment in warehouses, robots/automation, software, trucks, local delivery services, etc. And it was entirely undertaken by private sector companies like JD, SF Express and Cianiao Logistics (part of Alibaba). Today, China has the largest and arguably the most efficient logistics networks for consumer goods, which has grown tremendously over the last 15 years.
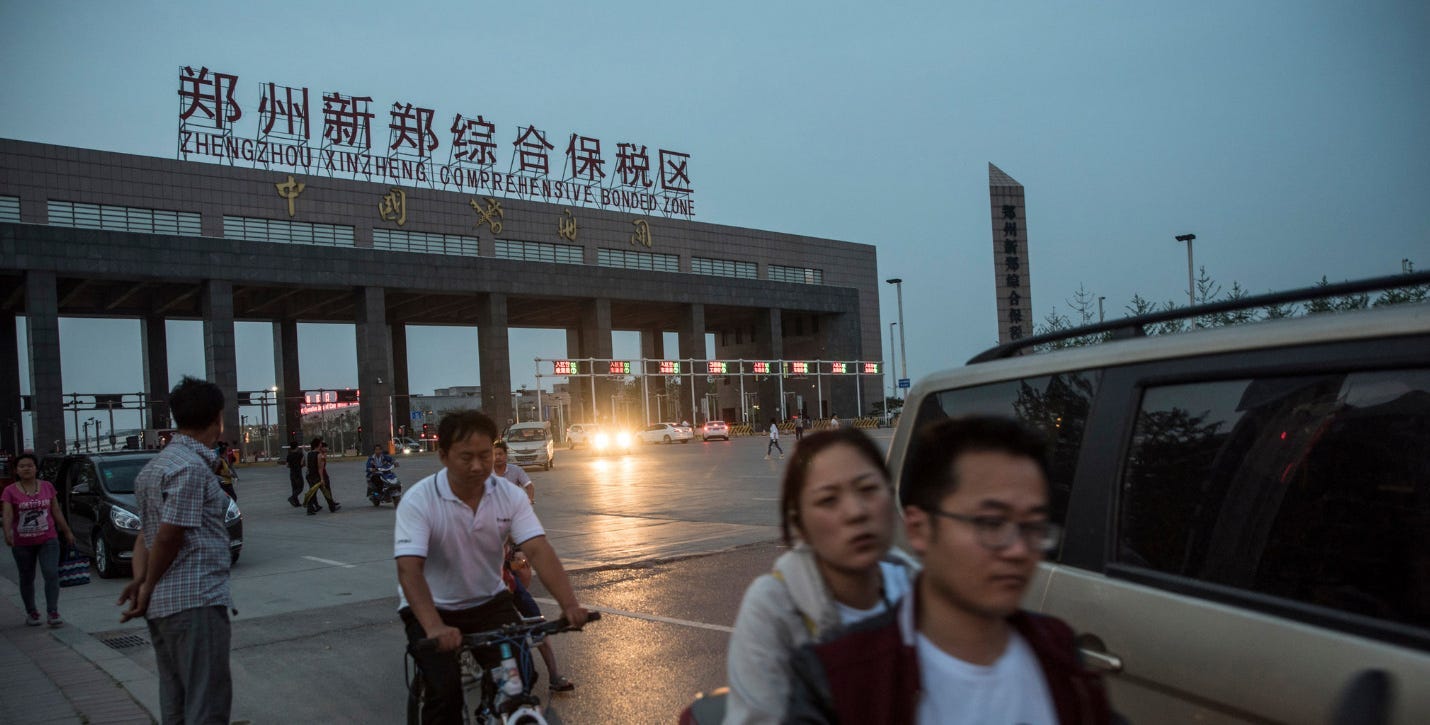
Moreover, prioritizing passenger rail did not prevent interior cities like Zhengzhou to thrive as manufacturing centers producing billions of iPhones shipped around the world.
To top it off, logistics companies are figuring out how to incorporate the HSR network itself into the overall delivery infrastructure.
Response #5: Bulk freight costs in China have not risen any faster than inflation
Finally, Zhao cites the increase in freight costs to support the idea that freight is unfairly subsidizing unprofitable HSR:
The second is that China Railway always relies on the continuous price increase of railway freight to make up for the serious losses of high-speed rail, thus driving cargo owners to road transportation.
After 11 adjustments since 2004, the price level of China’s railway freight has been gradually adjusted from 0.08 yuan/ton-km in 2004 to 0.1151 yuan/ton-km in 2012, 0.1301 yuan/ton-km in 2013, and 0.1451 yuan/ton-km in 2014, and 0.1551 yuan/ton km in 2015. In the 8 years from 2004 to 2012, the freight rate per ton-kilometer increased by 0.0351 yuan, while in the 3 years from 2012 to 2015, the freight rate per ton-kilometer increased by 0.04 yuan.
This is a relatively minor point, but I would just point out that this works out to a 6% annualized nominal increase in rates from 2004 to 2015 — essentially in-line with inflation over that period.
I am writing this in April 2023 and while one could argue that I should be using the 2022 numbers, there is the impact of the pandemic which has thrown everything off for everyone — particularly for public transport systems — so I am going with the 2019 figures. A separate analysis using more current data is warranted at some point but needs a big asterisk for the pandemic impact.
It is particularly contradictory if one was both (i) advocating for China to slow down infrastructure spending and (ii) lobbying for more investment in the freight network.
Great article - articulating lot of interesting points.
You said - `generally food is grown a lot closer to population centers`. Do you think if China had a better freight transportation network, it would open up opportunities for farther away provinces to grow and export food?
Appreciate the context and clarity here, as always!