Debt and the Chinese economy
A complex relationship
One of the most important questions about China is the role that debt and credit play in its economy.
Michael Pettis, a finance professor at Peking University, recently wrote an article published in the Financial Times (archive) on the feasibility of China’s goal of doubling its GDP by 2035. Doing so would require annual growth of “just over 4.7 per cent on average for the next 15 years” which on its own does not seem to be a stretch when you consider that the country has grown “6.7 per cent annually over the previous five years.”
Professor Pettis takes a different view, concluding that this is an “unlikely bet” based on the following key points:
This level of GDP growth would require credit growth that leads to debt/GDP ratios that are unsustainably high
The structural shifts required to re-balance the economy from Investment to Household Consumption will be difficult to execute politically
Productivity improvements need to make up for a decline in working-age population
For those who follow Professor Pettis closely, this position should not at all be a surprise. He has been remarkably consistent discussing these concepts and ideas over the years in his blog, his Twitter feed and his books, all of which I highly recommend that you read.
That said, I came to a slightly different conclusion:
There were some issues in the key assumptions that drive the model underpinning Professor Pettis’ analysis.
The structural changes needed to re-balance the economy are already well underway.
The impact of negative demographic trends is limited compared to other factors.
While far from inevitable, push comes to shove I would take the “over” on a bet that the Chinese economy will be able to double over the next 15 years while keeping debt within reasonable levels and avoiding a major political crisis. There’s execution risk here — leveraging domestic demand to drive continued productivity growth — but we are already seeing clear signs that this is already happening.
A Simple Modeling Exercise
My first job out of college was as an investment banking analyst in Deutsche Bank’s Hong Kong office, primarily focused on advising firms that were thinking about, or in the process of, acquiring other companies. Every deal needed a model, and this was one of the main tasks for analysts in their early 20s.
This meant spending countless hours building models. Early on, you learn the “hard” skills of how to mouse-lessly manipulate a spreadsheet but over time, you begin to pick up the “soft” skills that actually go into proper analysis. And as I moved to private equity and took on more senior roles, it became less about the modeling itself and more about judgment, informed by the accumulated experience of having seen thousands of models, of hundreds of businesses spanning scores of industries across multiple business cycles.

But the 22-year old investment banking analyst still lives on in my present 41-year old mind. Today, I still prefer to build my own models whether the goal is to evaluate a public or private company, invest in a real estate development, make a buy vs. rent decision on a car, analyze potential trades for my fantasy baseball team — pretty much anything, including forecasting and crunching data on the Chinese economy.
One of the most important things that I have learned over the years is that a model is only as good as the quality of its assumptions and the framework on which is built.
When I read this piece, naturally my first inclination was to re-build the model that lies at the heart of Professor Pettis’ conclusions. With it I could examine its framework and the underlying assumptions used to draw these conclusions with greater precision. Fortunately, the model itself is simple and straightforward. As described in an earlier series of tweets (emphasis mine):
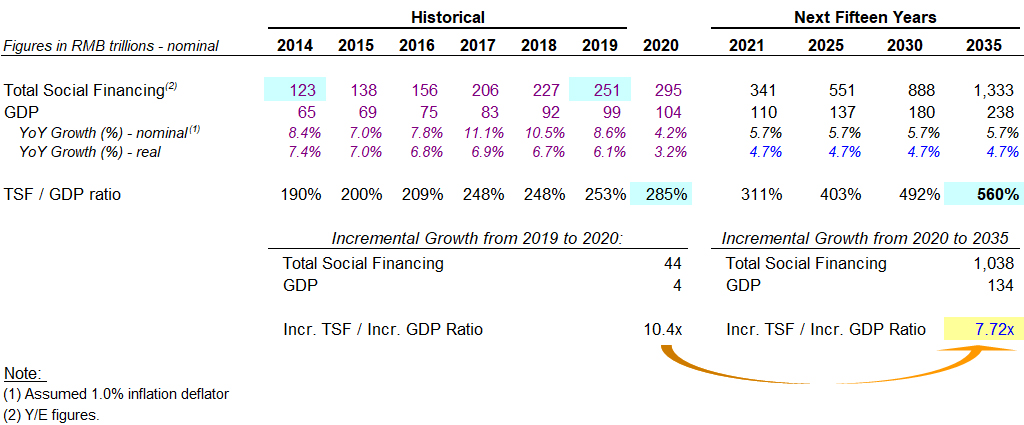
Consider that total social financing (the official measure of aggregate debt) grew in the past five years from 123 trillion to 251 trillion, or from 191% of GDP to 254% of GDP at the end of 2019, and that by the end of this year total social financing it will be around 280-85% of GDP.
Assuming (very, very optimistically) that there will be no deterioration from the past five years to the next ten years in the amount of credit growth required to generate a unit of GDP growth, this implies that by the end of the decade, China’s official debt-to-GDP must be at least 400% and perhaps as much as 450% if it is to reduce its growth rate by just 1 percentage point.
The key driver here is the fundamental assumption that there is a direct and causal relationship between incremental GDP growth and incremental credit growth. To determine the coefficient of this relationship, Professor Pettis looks back on the growth in credit and GDP over the past five years. He then extrapolates to forecast the next 15 years1.
Leveraging two-plus decades of financial modeling experience, after a flurry of keystrokes I was able to crank one out. Highlighted in blue are the numbers that more or less2 correspond to the description of the model and its output:
My 22-year old metaphorical self hands me the model output and asks, “we’re done here, right?”, his mind clearly somewhere else (my guess is Lan Kwai Fong).
My present-day self reviews the model and spots some problems: The debt numbers seem off; something is weird about the jump from 2016 to 2017; and the fool had forgotten to add version tracking like I had repeatedly asked! And what is the rationale for this specific historical range to drive the assumption?
I mark up the model and hand it back to him:
The first issue we’ve identified is that the ¥123 trillion figure at the beginning of 2015 is not calculated on an apples-to-apples basis with the ¥251 trillion at the end of 2019.
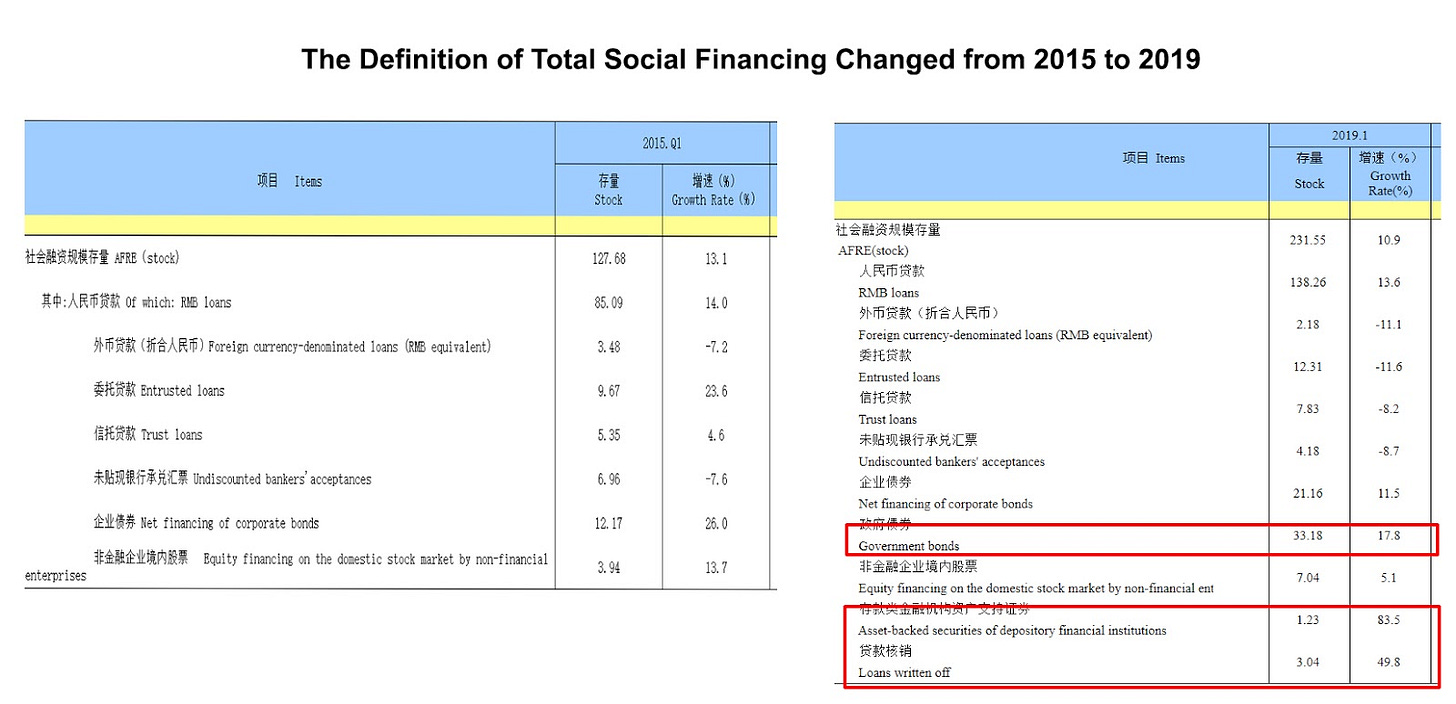
Launched in 2011 to track the rapidly expanding “shadow banking” sector, the Total Social Financing index has changed over time in an attempt to more accurately depict the ultimate borrowing in a rapidly evolving financial system. In 2018, a few new categories were added:

It’s not as if these newly added categories of debt did not exist in 2015 — this was merely a re-categorization. Adjustments need to be made for historical trend analysis or an accurate estimate of incremental debt creation3.
Properly adjusted, the historical TSF/GDP ratio actually only increased from 216% to 285% in 2020, reducing the implied incremental debt/GDP ratio from 4.4 to 4.0. Extrapolated out until 2035, the forecasted TSF/GDP ratio now only increases to 349% by the end of the period:
A model is only as good as its assumptions, and it is always good practice to challenge them instead of accepting them at face value. What is the basis for using 2015 to 2020 period as the historical reference period? Why are we assuming that the future will be exactly the same as this particular historical period?
Everyone knows 2020 is an outlier year because of the pandemic. As for the starting point, there’s not much of an explanation as to why 2015 was chosen as the starting point. And the past isn’t necessarily prologue.
Just to illustrate, let’s see what happens if we run the same analysis using the 2016 to 2019 period as the reference period to drive the key variable. Over this period incremental debt was only 2.8x incremental GDP. We plug it into the model:
As you can see, the aggregate debt/GDP ratio barely budges, declining slightly to 284% in 2035.
Now here’s the rub: We did not actually need a model to figure this out. It can be worked out from simple mathematical concepts that you probably learned in high school (or middle school, if you were – like me – that kid who took the short bus to high school for math).
Over a long enough time horizon, aggregate Debt/GDP will asymptotically approach whatever the long-term fixed assumption for the incremental Debt/GDP ratio happens to be. As long as you are assuming any level of nominal growth, over time the sum of incremental Debt/GDP rises as a proportion of aggregate Debt/GDP.
Thus if you assume 4.9x as in version 1.0 of the model, eventually your debt-to-GDP ratio will approach 490%. If you assume 2.8x as in version 3.0 of the model, the debt-to-GDP ratio will settle in at around 280%.
You can visualize this by simply extending the model beyond 2035 — notice how the debt/GDP ratio approaches but never quite reaches 490%:
To be clear, the point here is not to debate whether 2016-2019 or 2015-2020 is a better historical reference point. Indeed, my view is that absent careful examination or more explanation, both are rather arbitrary. At best, it is a shaky assumption that does not inpire a great deal of confidence.
The key point is that the model itself is based on self-fulfilling logic — where the assumption itself (a fixed incremental debt/GDP ratio) drives the ultimate answer (inability to manage debt/GDP above a certain level). In other words, the problem is the framing of the model itself.
A simpler way to say all this: Observe that from 2016 to 2019 the debt/GDP ratio increased from 243% to 254% while GDP growth averaged 6.6%. This by itself is clear indication indication that it is possible to grow at a meaningful level without significantly increasing the leverage ratio.
The relationship between debt and GDP is more symbiotic and complex. We need to dig a little deeper into this to get a better sense of what is going on.
Enhanced Credit Analysis
After moving back to New York in 2004, I did a short stint in the leveraged finance group. To raise capital from investors for our clients, one of the key tasks was drafting bank books and bond prospectuses. A typical credit statistics summary would look like this:
Here you can see the standard debt/EBITDA ratios — which are analogous to debt/GDP for countries/economies. But equally important was something called interest coverage ratio (e.g. EBITDA/interest) that would show a company’s earnings power relative to the cost of servicing its debt.
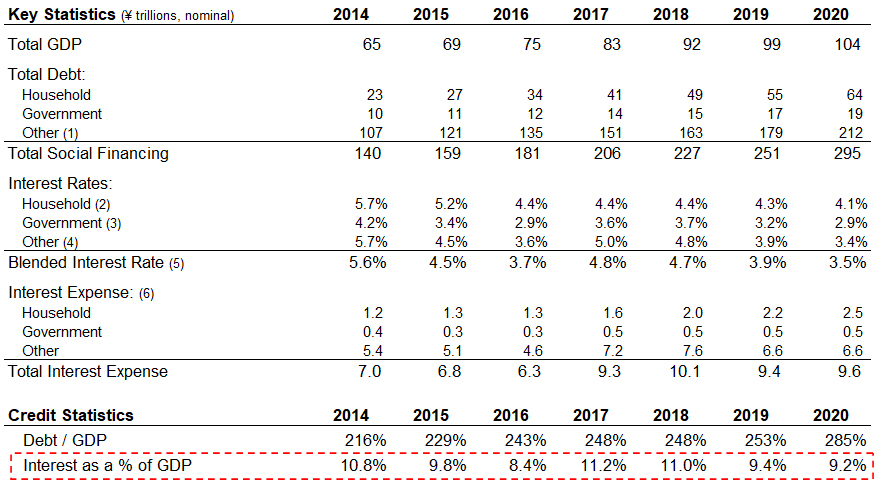
The corresponding metric at a country level is “Interest as a percentage of GDP”. This tells you how much an economy spends on debt service compared to the overall size of the economy. Unlike the total debt/GDP metric, this would factor in changes in interest rates over time.
The metaphorical leveraged finance analyst pulls various historical data to put this table together showing how China’s interest coverage ratio has changed since 2014:
Above we can see how even though the leverage ratio has increased over time, as rates have fallen in China — like much of the rest of the world — interest as a percentage of GDP has actually gone down after peaking in 2017. By this metric, debt service today s actually less of a burden on the economy than it was in 2014 and well below where it was two to three years ago.
Structural shifts are already well-underway
Professor Pettis is skeptical that the political changes needed to shift domestic demand from investment to consumption will be made:
China can in principle reduce its dependence on debt by shifting domestic demand from investment to consumption, as Beijing has long proposed. Yet this requires that the household income share of GDP rise from roughly 50 per cent today to at least 70 per cent.
Beijing has long wanted to do this but with limited success, despite a decade of trying. There is still little to suggest the party is willing to tackle the institutional implications of the large wealth transfer from local governments and elites to households this entails.
But I would argue that secular shifts are already well-underway in China’s economy that will push the economy to naturally re-balance over time.
One is the natural progression of households up Maslow’s hierarchy of needs. For the past two decades, Chinese households have been focused more on the bottom of the pyramid, as evidenced by a relatively high allocation of scarce resources to upgraded housing. The middle class cohort is now scaling the pyramid and focusing on higher-level needs — needs that tend to drive spending that is less debt- or capital-intensive in nature.
The other is the natural evolution in sector contribution from industrial to services activities. Industrial companies tend to be more capital-intensive, prioritizing physical assets over workers. Services companies tend to be more asset-light where salaries and wages make up a higher proportion of revenue. The shift from manufacturing to services — and from capital-intensive to asset-light — should result in labor being able to capture a higher of economic output over time.
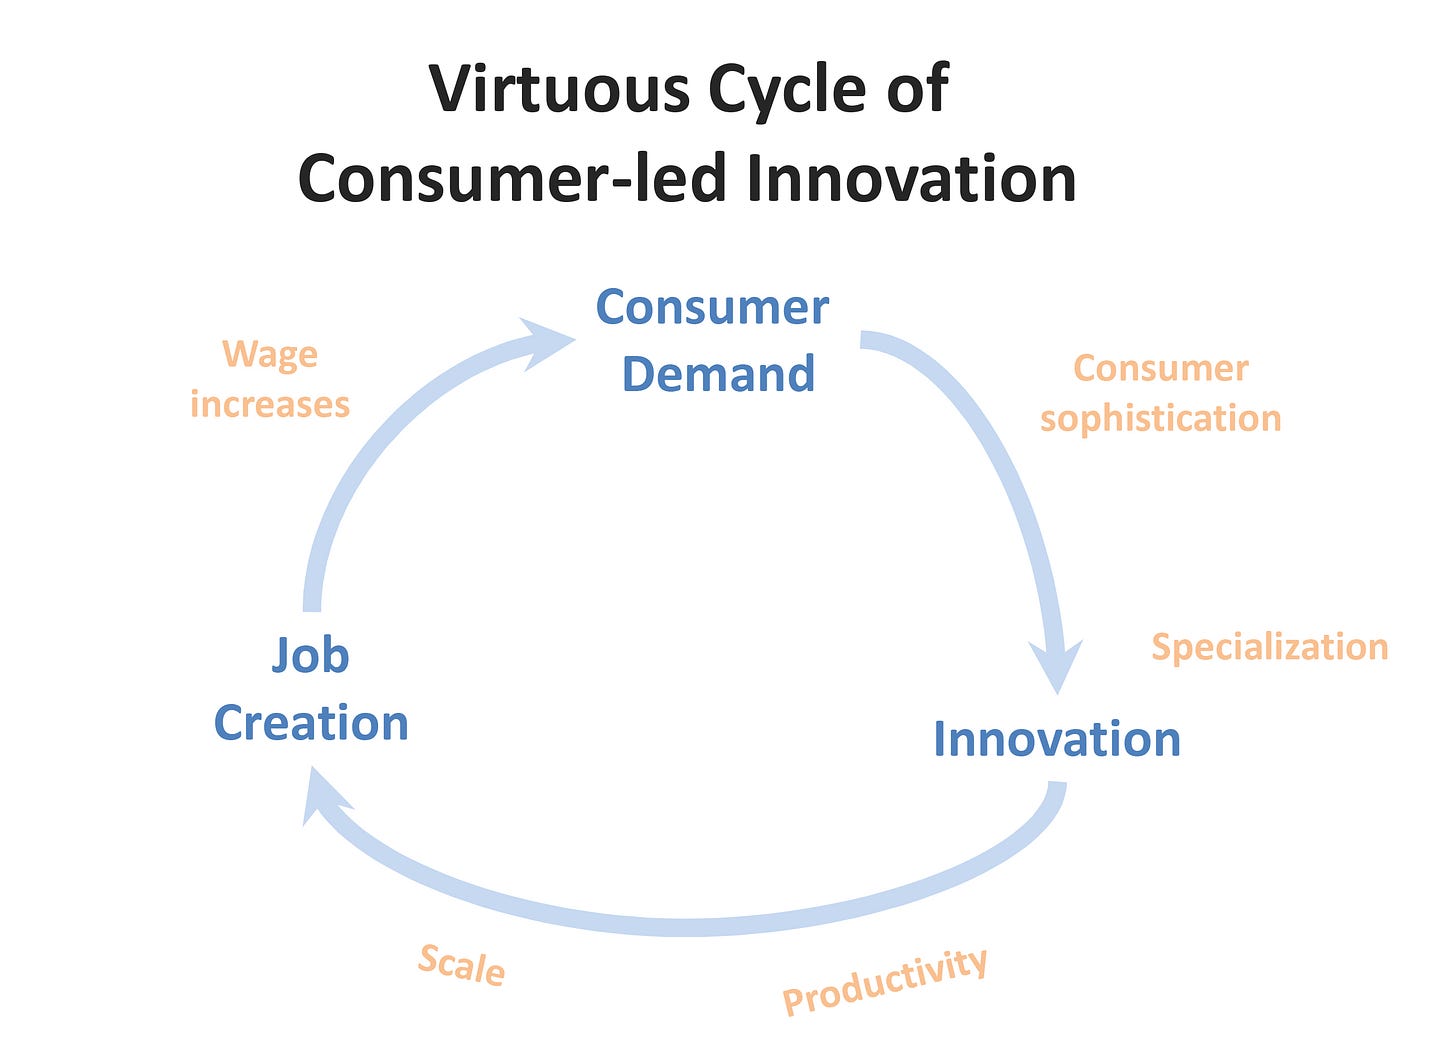
The convergence of these secular trends drives a virtuous cycle where consumer demand drives innovation and productivity improvements … which drives job creation and wage increases … which then drives more consumer demand, completing the loop.
In other words, this virtuous cycle of consumer-led innovation is the “entirely new engine of economic growth” that will drive the shift from Investment to Consumption over the next fifteen years.
From a political perspective, I do not see anything here that is particularly controversial. If anything, this mental model dovetails well with the “internal” component of the recently unveiled “dual circulation” strategy, the major byline of the 2021-2025 plan. Recent anti-monopoly draft legislation further emphasizes regulators’ rather pro-consumer bent.
Demographic headwinds vs. catch-up potential
Professor Pettis brings up the oft-discussed idea of the demographic headwind:
There is also a demographic problem. From the late 1970s, China benefited from a rapidly rising working-age population, but this reversed around a decade ago. In fact, over the next 15 years, while China’s population will grow by an estimated 1.5 per cent, its working population will decline by an astonishing 6.8 per cent, and will continue to decline for the rest of the century. To put it in context, while today there are 4.7 Chinese of working age for every equivalent American, by the end of the century there will be only 2.4.
This has economic implications. Achieving GDP growth of 4.7 per cent with a declining working population requires as much productivity growth per worker as 5.2 per cent GDP growth with a stable working population. Growth in Chinese labour productivity has in fact fallen steadily since 2010. Looking ahead, a declining working population requires that the pace of this decline in productivity drops by nearly two-thirds if China is to double GDP by 2035.
Nothing to really debate here with the numbers: Assuming a 6.8% decline in working-age population, China will have to make up around 45 bps per year in per-worker productivity basis to achieve a doubling of GDP by the end of 2035.
Hyperbole aside, it adds to the challenge but is far from insurmountable.
There is still significant catch-up growth left for China. China’s per capita GDP (nominal) is currently 17% of the United States. This is roughly where Japan stood in the early 1960s and where South Korea was by 1987. In both cases, there were multiple decades of catch-up growth ahead: in the subsequent 15-year period, Japan grew at an average rate of 16.2% while South Korea grew at 10.5%. These periods included the OPEC oil embargo for Japan and the Asian financial crisis for South Korea4.
While China’s scale makes it impossible to follow Japan and South Korea’s export-led paths to wealth, it also conveys a major advantage by allowing it to use its domestic engine as the main engine for growth and productivity improvements. As I wrote in 2015:
While China could not “export its way to wealth” like Japan and a few other East Asian countries did, there are some nice advantages to having scale.
Having such a large population means that you will inevitably have the largest home markets for most industries. Unlike Japan, China can utilize this massive domestic market to become the main driver for the economy and innovation going forward. Japan had a decent-sized market, but even then it was less than a third the size of America’s.
In 2021, analysts are now forecasting that China will grow around 7-9%, with the economy trending back on track and favorable comps from the pandemic-affected 2020 numbers. This gives Chinese policymakers a bit of a head start on the goal to “double GDP by 2035”. If growth comes in at the high end of the range, it means that growth hurdle required to double over the next fourteen years will be reduced by 30 bps per year (from 4.73% to 4.43%). This puts some perspective on the previously mentioned 45 bps demographic headwind.
Far more significant than the size of the working-age population will be the number of machines, robots and software licenses deployed in the Chinese economy over the next 15 years. In a post-industrial economy it is far less about labor and all about productivity. There is certainly execution risk here but this outcome is well within the range of reasonable outcomes.
This all said, 2035 is so far out in the future that it would be a bit silly to hold such strong convictions no matter which side you come out on.
In an earlier tweet (archive), Professor Pettis cites a 10-year forecast period to reach 400% debt/GDP vs. a 15-year period used in the FT article. The math really only works with a 15-year period, so one can only assume that these earlier forecasts were based on different.
In another tweet (archive) on the same topic, the same 15-year forecast period is cited, but the forecasted 2035 debt/GDP ratio is 560-690%, implying an incremental debt/GDP ratio of 8 to 10x. Not exactly sure where this assumption is derived from — perhaps the incremental debt/GDP ratio over this current year?
The variable that could not quite be replicated was matching the incremental debt/GDP assumption with the historical incremental debt/GDP. The model only works at 4.9x. But as one might say, “close enough” for illustrative purposes and one can argue that this fulfills the “deterioration … in the amount of credit growth required to generate a unit of GDP growth” comment from the earlier tweet (archive).
To make the model fit better, I also had to make an assumption on the inflation deflator and calculate everything in nominal terms. But this raises another problem with the model — if you change the deflator, the forecast debt/GDP ratio also changes. Ths really shouldn’t happen in the real world — and points again to there being a more fundamental issue with the way the model and assumptions are constructed.
The PBOC provided restatements going back to 2017. Credit ratings firm Fitch recognized this discrepancy and made the proper adjustments going back farther in time.

Based on a broader set of metrics, I would argue China today is more similar to Japan in the mid-to-late 70s (vs. the 60s). From 1978 to 2002, Japan’s economy grew at an average of 7.6% per year.


Thanks, Glenn! A masterful model-based prediction, from an analyst in a different area trying to follow it all. Me, worry? 2035 is very far off, and the Chinese caretakers today have should themselves capable of timely adjustments.
I am confident that China can achieve two of the three challenges
They will continue increasing consumption while reducing savings. This is influenced by generational attitudes
They will improve productivity in spite of aging populations. They will innovate with automation and robotics