Is the California High Speed Rail project worth it?
The $67-100 billion question
LA Times: Inflation and delays could add billions more to bullet train project costs
When analyzing high fixed-cost projects like the California High-Speed Rail project, from an economic perspective there are really two major factors to look at closely:
First are the up-front costs. The lower the better.
Second is capacity utilization. The higher the better.
These two factors alone can explain most of the economics of the business. After we get a handle on the base economics, we can consider less-easy-to-measure externalities such as pollution reduction, job creation and quality of life measures.
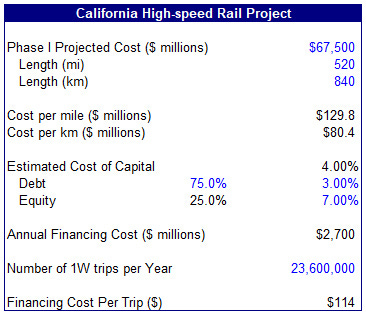
The project’s latest (base case) estimate is $67.5 billion for Phase I (in current-year dollars), which is to effectively connect Los Angeles with San Francisco with the main line running through California’s Central Valley. With total track of 520 miles (840 km), this averages out to $130 million per mile ($80 million per km).
$130 million per mile is a very high number. We know this because we can compare the cost of this project to others done in the past. For example, European HSR projects range from $48 to $78 million per mile and Chinese HSR projects range from $22 to $32 million. These figures have been adjusted to 2018 price levels to make it a more apples-to-apples comparison.
These up-front capital costs show up in the project economics in the form of financing costs. Using a cost of capital rate of 4% on the project cost (blended debt and equity) — which is quite low — we are looking at roughly $2.7 billion in annual financing costs alone.
Okay, so we know the project cost is really high. But can they make up for it in high capacity utilization?
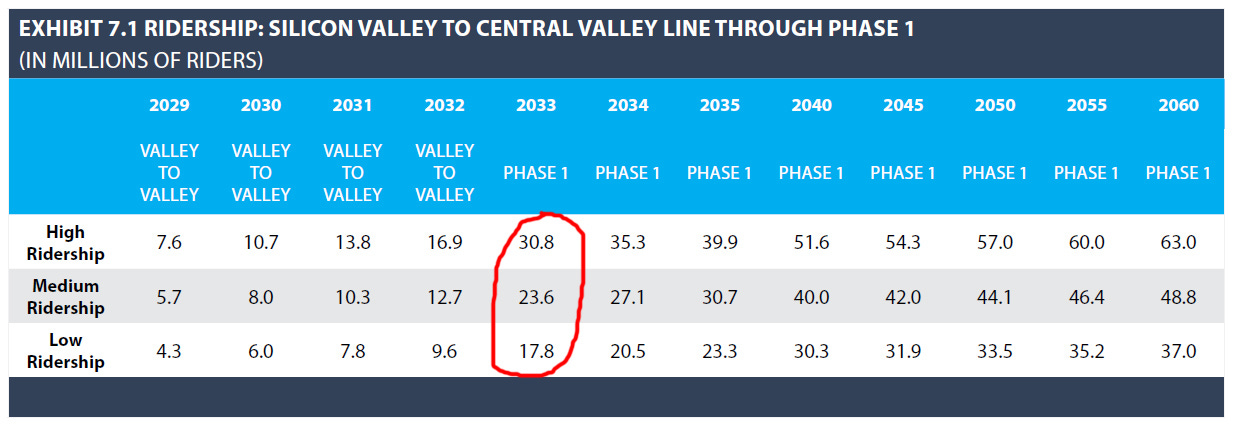
According to its latest business plan, the California High-Speed Rail Authority’s (CHSRA) is forecasting a base case of 23.6 million riders per year when Los Angeles and San Francisco (a.k.a. “Valley to Valley”) are linked in 2033.
The first issue I see is that even if we take these projections at face value, the estimated fare price would not even be able to cover the projected financing costs. Using the medium case annual ridership estimate of 23.6 million, we get to a financing cost of $114 per trip:
Remember, this does not even cover operations and maintenance costs, much less principal repayment. And 4% is a very low blended cost of capital, even in the context of the past decade of extremely low interest rates.
The second issue is that I am not even sure we can take these ridership projections at face value. Ridership projections will be very much dependent on the cost of alternatives and in this case, it will be either driving or flying.
A typical round-trip airline ticket between SFO and LAX is less than $200. In other words, you are talking less than $100 for a one-way ticket. It will be hard to convince a large number of passengers to pay double the price (or more) to ride on a high-speed train.
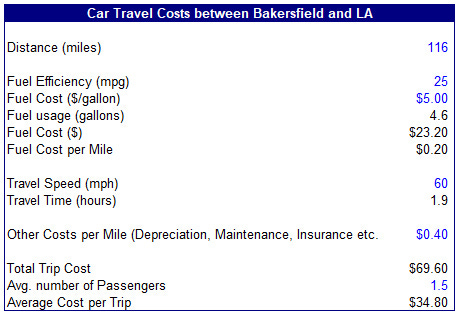
For shorter trips (e.g. between Bakersfield and Los Angeles), now you are starting to compete with just regular driving. For the 116-mile trip between the two cities, we are talking about $35–40 per trip (per passenger):
I reviewed older business plans to get a better sense of how the ridership estimates were derived. Unfortunately, the reports did not provide detailed analysis as to how the ridership forecasts were derived.
And the ridership projections just did not make a lot of sense to me. For example, drawing from past experience, high-speed rail deployments are typically effective replacements for point-to-point air travel for distances in the range contemplated by the San Francisco to Los Angeles corridor. Each year there are around 3.7 million flights between the Bay Area and Los Angeles — an order of magnitude lower than the 23.6 million ridership forecast.
Another data point is the Amtrak line linking Boston to Washington, D.C. via New York City. The distance from Boston to Washington, D.C. is comparable to San Francisco to Los Angeles (around 450 miles). With a population of approximately 49 million along the line, this is the densest region in the United States (the entire population of California is around 40 million). Ridership on the Amtrak lines was about 12 million in 2016. This figure includes all rides, including short-haul trips from New York City to Philadelphia — not end-to-end rides from Boston to Washington, D.C.
The ridership forecasts just do not seem to be grounded in reality.
And the big risk is that if they get the ridership forecast wrong, the economics of the entire project can spiral out of control very quickly. Reducing ridership estimates from the medium case of 23.6 million to the low case of 17.8 million increases the amortized financing cost per trip to $174. Lower ridership means higher cost, which leads to a further reduction in demand — it’s a slippery slope.
I am a big fan of high-speed rail in general, but the economics need to work and from my vantage point, they don’t work … by a long shot. I totally buy into the positive externalities (e.g. environment, job creation, increase in economic activity) but currently the economics are so out of whack (at least in my model at what I consider to be more realistic ridership assumptions) that we cannot even start to consider those.
As I wrote in another article, I think the U.S. just has certain characteristics (e.g. low population density, lots of suburban “sprawl”, high land acquisition costs, Car culture etc.) that make it difficult for high-speed rail to be implemented.
But before I reach a more definitive conclusion, I still have open questions:
I would love to get more detailed breakdown of the construction budget — how the money is spent is important. Is it high because the topography makes it extremely expensive to build? That would not be good. Or is it high is because of very high land acquisition costs? This is a little better — it’s sort of like a tax paid for by residents of California to communities along the right-of-way. It’s not ideal, but at least the money is staying within the system (sort of).
I would also love to get more detailed analysis as to how the California HSR Authority came up with its ridership figures so I can better assess how realistic they are.
This was originally published on Quora in November 2018.


I was living in California in 2008 when the initial bond measure was passed....the critics turned out to be 100% correct