How profitable is China's high-speed rail?
A look into the financials of China Railway Corporation
China Railway Corporation (中国铁路总公司 or “CR”) is a state-owned enterprise that owns and operates the vast majority of China’s railway network. This includes commercial freight operations, regular-speed passenger rail and virtually all of its high-speed rail operations. It is the successor to the now-defunct Ministry of Railways which was re-organized in March 2013.
Even though CR is not publicly listed, because it is one of the largest public bond issuers in China, CR releases its financials on a quarterly basis. For example, you can find its latest annual financial report here: ChinaBond — China Railway Corporation 2017 Financial Report.
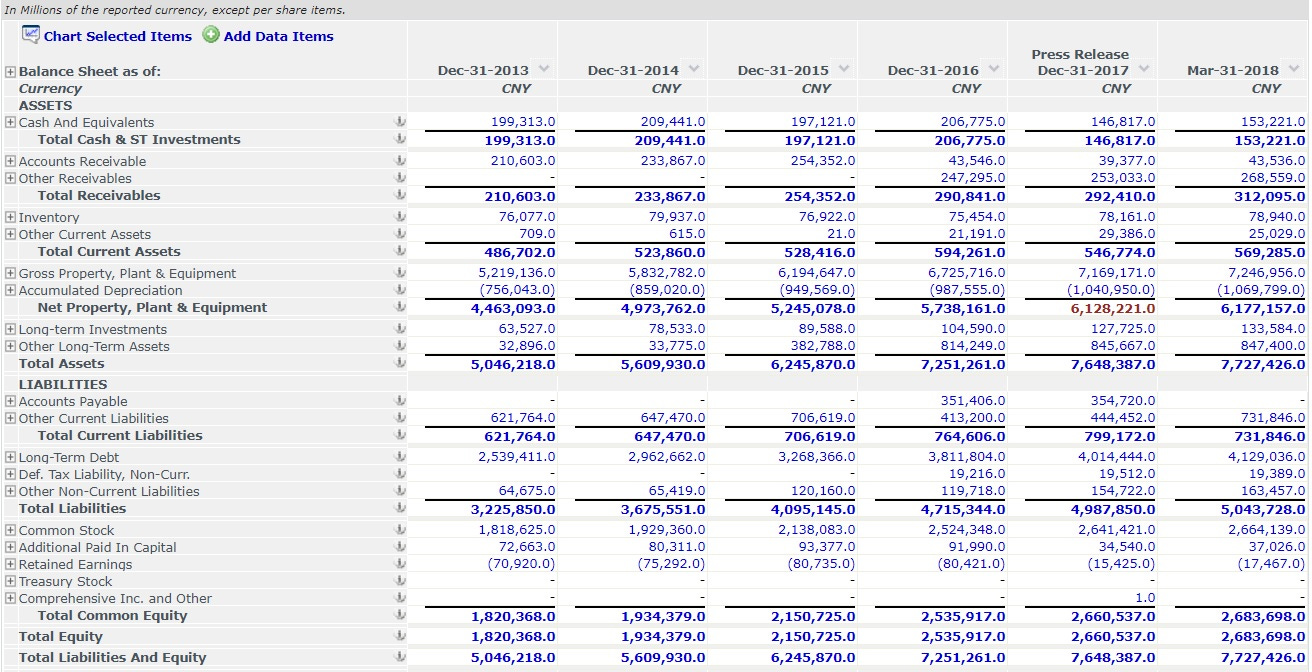
Here are its historical financials (income statement and balance sheet) since incorporation. These are screenshots from Capital IQ but the figures are sourced directly from the annual reports found in the link above.
To answer this question about profitability, we need to know some accounting and a little about the financial nature of the railway business. To be honest, it was a little confusing at first even for someone who is pretty experienced at this stuff due to differences in the way the numbers are presented, but I was able to eventually work it out.
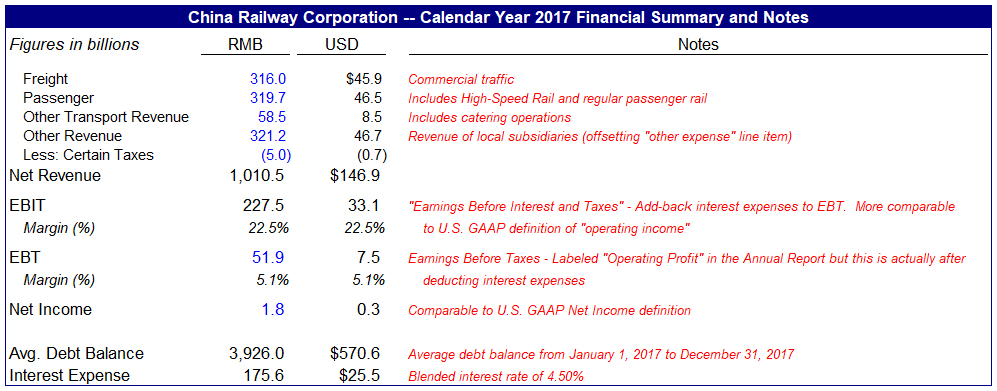
I’ve tried to extract the relevant figures from the raw data above, present them in more familiar “U.S. GAAP” style terminology and explain where the discrepancies are in greater detail in the following tables and text:
As you can see, CR’s revenue is a combination of freight, passenger and “other” revenue. High-speed rail makes up a majority of the “Passenger” revenue line item.
“Other transport ” revenue includes railway-related real estate operations.
Examples of this would be rental revenue received from shops or advertising revenue from billboards located in train stations.
Train stations are obviously very high-traffic locations and can generate significant economic value based on their abilities to draw foot traffic.
“Other revenue” includes revenue earned at the subsidiary level. There is an offsetting “other expenses” line item in the detailed financials. This is related to how China Railway is structured between its central and local operations.
What is translated in the annual report as “Operating Profit” (Chinese: 营业利润) is actually what financial analysts in the United States normally refer to as “Earnings Before Taxes” (EBT).
The interest expense figure is not explicitly broken out in the income statement, so it must be aggregated into one or two of the other income statement categories (see Note 1).
Fortunately, as CR bonds are publicly listed, we can make a fairly accurate estimate of the interest it is paying based on its disclosed debt balances and estimated interest rates — which have ranged on a blended basis between 4 and 5% (see Note 1).
Adding back this estimated interest expense to EBT, we can arrive at Earnings Before Interest and Taxes (EBIT) which is the more standard definition of “operating profit” in the United States.
Overall, I estimate that China Railway Corporation generates a relatively healthy operating margin of around 20%.
But we aren’t done yet. As mentioned before, high-speed rail is just one part of CR’s overall business alongside the commercial freight business, regular-speed passenger rail and real estate operations. We need to go another level deeper.
Some analysts that are more skeptical or critical about China’s massive high-speed rail build-out have questioned whether the more profitable commercial and freight operations are subsidizing a “loss-making” high-speed rail business. For example, the FT cited one source saying that high-speed rail accounts for “as much as 80 per cent of the company’s debt burden is related to HSR construction”.
However, if we look at another snapshot of the historical financials of China Railway Corporation, I think the answer is more nuanced:
A few things jump out at me here:
As passenger revenue grew — driven by growth in high-speed rail — the gross margin of the business declined significantly from 2013 to 2016.
Part of this appears to be driven by a general slowdown in the non-HSR business e.g. the freight business. Nonetheless, the data suggests that rapid HSR growth was contributing to a decline in profitability in the business, at least at the gross margin level, over that time period.
This suggests that from 2013 to 2016, HSR was less profitable than the other operations, such that growth in HSR lowered the gross margin of the overall business.
However, in 2017, as passenger revenue continued to grow at a healthy clip (driven entirely by HSR), the gross profit and operating margins in the business began to pick up. Based on the most recent operating data (through July 2018), HSR appears to still be following this path.
So why was HSR less profitable in the earlier years? And how is it going to become more profitable in the future? Let’s again dive another level down and examine the economics of the rail business itself.
Rail networks are classic high upfront investment businesses with extremely long useful lives. Significant capital is required to build out rail lines, train stations, intermodal links, depots, signaling systems, electrification equipment, relocation expenses for residents affected by construction, capitalized interest on construction loans etc.
For these types of businesses, perhaps the most significant financial driver is something called capacity utilization. High fixed-cost businesses need to be utilized so that the up-front construction cost may be amortized across variable usage. In the case of rail networks, this takes the form of trying to lower your depreciation charge per passenger-km.
Once operational, new rail lines often have long ramp-up periods. This is because people, businesses and habits need time to adjust to this new transport alternative. People adjust their commutes, perhaps switching from air travel to high-speed rail. Local businesses sprout up around the new train stations. New residents move in, attracted by proximity to the station and all the new activity. Tourists find it easier to travel for fun. Lower costs or commute times gradually enable new ways of doing business that eventually result in productivity growth.
Even after a line is fully operational and mature on its own, it may still not be working at full capacity because the rest of the rail network has not yet been fully completed. As new lines are extended connecting existing lines to new regions, there will be new spur/transfer traffic coming from the new line that benefits the existing line. So until a rail network is fully built out, there will always be room for further improvement in potential capacity utilization and yield.
Low capacity utilization is a common feature in the early years because all of these adjustments take time. If the project wasn’t a complete disaster, capacity utilization should gradually rise over time as people find more reasons to use the new rail line.
Low capacity utilization during the ramp-up period translates into sub-par financial results. New rail lines are simply not going to be as profitable as more mature rail lines that have reached their planned capacity targets. Financial losses during the ramp-up period should not be surprising for new rail lines.
China’s high-speed rail network appears to be following this trend.
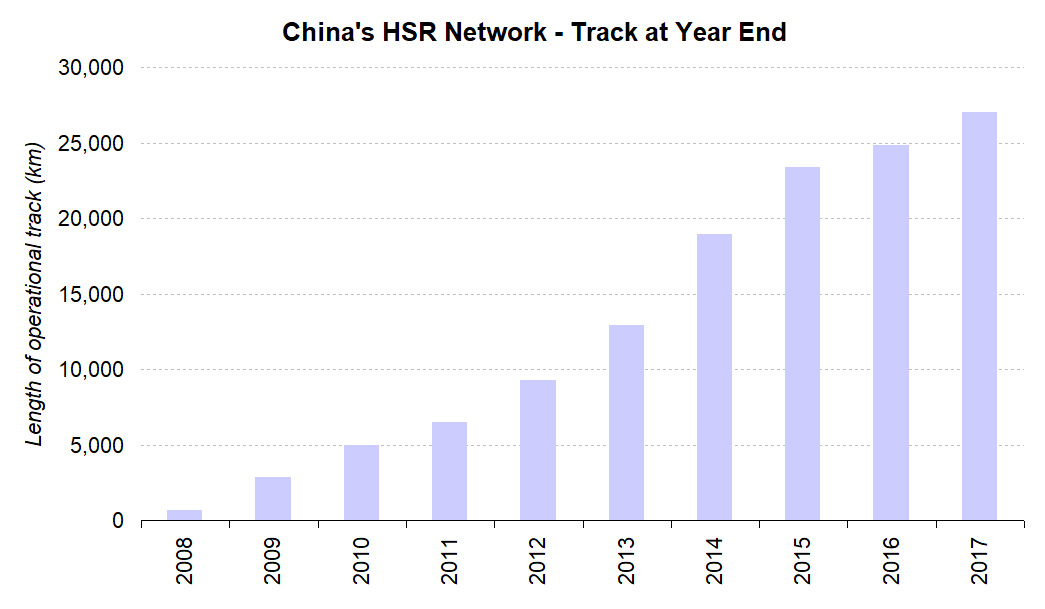
After the Global Financial Crisis, high-speed rail projects that had been on the docket were fast-tracked. This sparked the first huge boom in high-speed rail construction from 2009 to 2011. The 968-km Wuhan–Guangzhou line opened up in late 2009. Beijing–Shanghai was completed in mid-2011. By 2011, China had topped 8,000 km in HSR track, already making it the world’s largest network.
After the Wenzhou train collision in July 2011, a moratorium was placed on construction but by early 2012, things were back on track. At the end of 2013, China had close to 15,000 km of operational track. There was another big investment boom starting in 2014. By 2015, the number had topped 20,000 km and as of today (August 2018), it is approaching 30,000.
With so many new lines ramping up their capacity, capacity utilization was relatively low in the early years. But as the lines have matured, capacity utilization rates have shot up. In 2012, the average occupancy rate of HSR in China was 57%. This percentage steadily increased from 65% in 2013 to 72% by 2016.
Today the number is even higher as the pace of new HSR line construction has moderated somewhat while existing lines have ramped up towards — and in some cases exceeded — their original intended capacity targets. For example, it took the Beijing-Shanghai line almost four years to reach operational breakeven in 2015 and today it is the most profitable line in the system.
With the steady rise in capacity utilization, CR’s profitability and financial metrics have improved. And they should continue to improve as the HSR network matures and as the economy “digests” new rail lines. The freight and real estate business had clearly been subsidizing HSR in the early years but it looks like HSR — now the fastest-growing part of CR’s business — is rapidly improving its profitability metrics as capacity utilization continues to rise across the system.
The other thing that needs to be said about high-speed rail and public infrastructure projects in general is that GAAP financials often do not accurately capture the total societal benefit. There are many positive externalities that are associated with public transportation infrastructureranging from reduction of pollution/carbon to better quality of life to the network effect value of encouraging more economic interaction and connections.
Most governments recognize these positive externalities and often look to subsidize their rail operations. East Japan Railway is relatively healthy with a 16% EBIT margin. SNCF (France) runs at about a 6% operating margin. Amtrak (U.S.) runs at a major operating loss. But I would argue that all — even loss-making Amtrak — are overall positives for their respective economies due to the positive externalities they provide that do not show up explicitly in their operating metrics.
So even as HSR runs at a lower profitability margin than CR’s overall ~20% level, one needs to take into account the fact that many lines are still ramping up as well as the societal benefits that are not captured in the financials alone.
Note
(1) This is based on my analysis of over a hundred outstanding CR bond issuances including issue amount and coupon rate. Also sourced from Capital IQ. Example screenshot:
The Annual Report actually does provide an interest expense break out in the “Sources and Uses” table but the number was too low (¥76 billion) to apply to the entire approximately ¥4 trillion long-term debt load. What I think is happening here is that this figure only relates to the interest paid out on CR’s public bonds, which only represent part (around 40–45%) of the entire debt amount.
The typical financing structure for China HSR projects uses a combination of secured and unsecured bonds issued by CR at the corporate level, project-level loans from an issuer like the China Development Bank and equity from local partners. I am still searching for interest rate data for project-level loans (which I suspect will be moderately lower than the bond rate) and will update this analysis accordingly.
I also suspect that the interest expenses paid on the project-level loans may even be baked into the cost of revenue line item. However, I am not sure about this.
This was originally published on Quora in August 2018. Updated in December 2020 with some minor corrections and updates.


