How does Alibaba generate such a high profit margin vs. Amazon?
A compare and contrast of the two Internet giants
Alibaba generates consolidated operating margins north of 30% while Amazon struggles to break single-digits but because of differences in business model and accounting treatment, comparing these two figures is essentially meaningless.
To properly answer this question, you really need to peel the onion on both companies to see how they are similar and where they are different. Done right it can offer interesting insights in the two companies themselves and also shed light on some key differences between the United States and China as it relates to e-commerce, society and general economic conditions.
In past work, I had done some of the onion-peeling already and I thought it would be helpful to share some of what I found.
Picture Source: Oorjit
From the bleacher seats, Amazon and Alibaba appear to overlap in many areas:
In their core e-commerce businesses, they function as a marketplace using the Internet to connect suppliers of goods and services to buyers
They host digital media streaming services over the Internet
They provide outsourced cloud infrastructure services (computing power and storage) to business customers
They re-invest much of their economic profits back into growth and new business areas
But head down to field level and you will soon realize how differently they go about executing their respective business strategies. This has significant implications in how accounting revenue is recognized, how “profit margin” is calculated and how it all should be interpreted.
Another difference — and one that has mostly shaped the way each attacks its respective markets — is the competitive sandbox within which each operates. The operating environment in China for Alibaba is very different from a stage of development and competitive dynamic perspective than Amazon’s core markets i.e. wealthy, developed countries. And the manner in which Alibaba and Amazon re-invest shareholder earnings back into new growth areas also differs quite a bit.
All of these differences impact how you calculate, normalize and interpret the “profit margin”. For this analysis, I broadly define “profit margin” as operating income (see Note 1 for further explanation). Also for this answer, I am going to focus exclusively on the e-commerce operations which are the most mature divisions for both companies.
Interestingly, one thing I discovered was that Amazon actually extracts more out of every transaction that goes across its e-commerce platform. But this is primarily because Amazon needs to do more work on the fulfillment side requiring higher opex and capex investment as well as inventory working capital.
In aggregate terms, Alibaba’s e-commerce business actually generates significantly more cashflow for shareholders due to greater scale and higher market share in its core market. Moreover, its unique approach requires much less fixed overhead investment to grow as fast or faster than Amazon.
Both companies have massive growth opportunities ahead — opportunities to deploy their rapidly growing cashflow into very large markets on an advantaged basis. And the way that each of them goes about re-investing in growth opportunities is quite different. In the coming years (and decades) it will be fascinating to watch them compete especially as they start to bump into each other more directly in markets like India and Southeast Asia.
With that, let’s start peeling that onion.
Step 1: High-level analysis
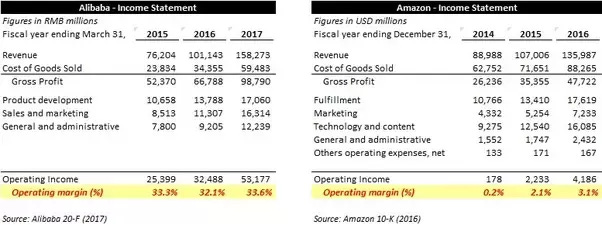
Here are top-level financials for Alibaba and Amazon:
Here you can see Alibaba is running at a 34% consolidated operating margin while Amazon is barely over 3%. At first glance the difference seems massive but it is like comparing your SAT score to your ACT score — in absolute terms quite a meaningless comparison.
The first problem in this comparison is that both Alibaba and Amazon are a hodgepodge of different businesses. For example, Amazon has a large cloud infrastructure business (Amazon Web Services) whose financial profile looks very different from its e-commerce business. Alibaba also has a cloud infrastructure business but the market is still quite nascent in China compared to North America.
So the next peel of the onion involves isolating the e-commerce business.
Step 2: Segment-level analysis
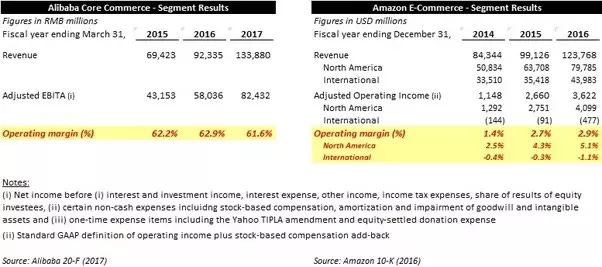
The good news is that both Alibaba and Amazon provide segment financials in their public filings which separate out e-commerce from the rest of the business.
You may have noticed the “Adjusted EBITA” in place of operating income under Alibaba. This is how Alibaba reports its segment-level data and I explain in Note 2 why it is an appropriate proxy for operating income.
Lo and behold, the difference in operating margins is even higher when you focus solely on the e-commerce businesses with Alibaba running north of 60% while Amazon sits in the low-to-mid single digits — or even negative in the case of its operations outside North America.
Once again this is also not an apples-to-apples comparison because of critical differences in revenue recognition.
Step 3: Understanding how revenue is recognized differently between Alibaba and Amazon
Both Alibaba and Amazon connect buyers with goods and services that they sell on their platform.
Generally Amazon acts as the retailer and handles everything from advertising, marketing, fulfillment (warehousing) to delivery, payment processing and customer service. In contrast, Alibaba takes a more hands-off approach, pushing much of the responsibility for fulfillment, delivery and customer service to other retailers and acting more like a marketplace.
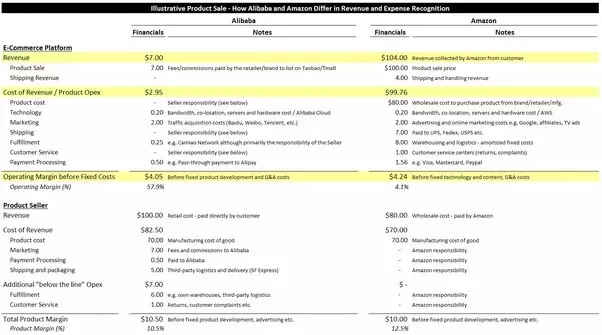
This difference results in accounting treatment that is completely different for the two companies. To illustrate, let’s look at how the sale of a $100 item might flow through their respective financial statements.
As you can see in the illustrative example, the same $100 product sale results in only $7 of recognized revenue for Alibaba but over $100 for Amazon. But from an “economic value capture” perspective — represented by “Operating Margin before Fixed Costs” — Alibaba and Amazon both capture approximately 4% of the retail price.
Step 4: Normalizing the numbers (as much as possible)
With “Operating Margin before Fixed Costs” in the table above we are starting to get to a more apples-to-apples comparison of the true economic value being captured by the two e-commerce giants.
If we go back to the Segment Financials and dig through company disclosure to match up the different buckets of opex, we can get to an estimate of what this figure looks like on an aggregated basis:
The table above introduces the concept of Gross Merchandise Value (GMV) — this represents the aggregate value that transacts across any given e-commerce platform.
GMV helps adjust for the difference in revenue recognition methodologies between Amazon and Alibaba. But there are some problems with GMV comparisons between Alibaba and Amazon so I have adjusted GMV to what I believe is a more accurate “Net” Merchandise Value figure. Please see Note 3 for more detailed discussion about GMV and why you need to adjust this figure.
We are now at the point where we have done our best to normalize the numbers between Alibaba and Amazon. These numbers are based on various estimates and probably do not fully account for some differences between Amazon and Alibaba. But this is probably the best we’ll get to based on public information.
We’ve finished peeling the onion and we are ready to start drawing some conclusions.
Conclusion #1 — Amazon captures a higher percentage of each “true dollar” that transacts across its platform.
From that last table, you will notice that Amazon (at 4.6%) is extracting a higher percentage of each transaction than Alibaba (3.8%). While these figures are based on quite a bit of estimating, they should be directionally correct. It makes sense that Amazon’s is higher because it needs to do a lot more work compared to Alibaba which operates as an asset-light, pure marketplace.
Specifically, Amazon needs to invest in a network of warehouses, hire hundreds of thousands of workers, manage seasonality, hold and manage inventory etc. For this they should get a higher cut of each transaction to account for higher costs and risk.
I should note that Alibaba also gets involved in fulfillment as well but with a much lighter touch. For example, its subsidiary Cainiao Networks is a software overlay that coordinates hundreds of third-party logistics providers on behalf of its customers. Unlike Amazon, Alibaba does not own and operate the warehouses and trucks involved in moving product from the source to the end user.
Conclusion #2 — Alibaba’s e-commerce business is significantly larger than Amazon’s
Despite the first conclusion above, in aggregate Alibaba’s operating profit ($14.1 billion) before accounting for fixed overhead costs like product development and G&A is already significantly higher than Amazon’s ($11.8 billion).
Alibaba is much bigger than Amazon when it comes to e-commerce. This is a function of three main variables:
Overall China retail spending is massive (1.4 billion consumers!)
Online is a higher percentage of overall retail sales in China vs. the U.S.
Alibaba has significantly higher online market share than Amazon.
And the gap is widening as Alibaba continues to grow at a significantly higher rate than Amazon.
Conclusion #3 — Alibaba’s competitive environment is more favorable than Amazon
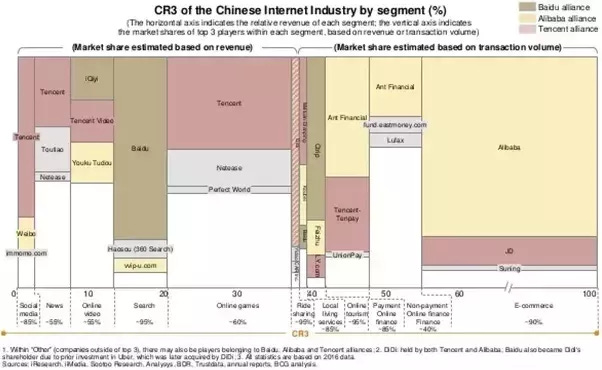
Alibaba is significantly larger than its competition. In the online retail world, it is about 5x larger than the next-largest online competitor (JD.com) measured in GMV terms. Traditional retail in China was historically relatively unsophisticated and did not really produce any scale players. Tencent is really the only player that can go head-to-head with Alibaba and they do not compete head-to-head in e-commerce.
Source: BCG “Decoding the Chinese Internet” (September 2017)
Meanwhile, Amazon has had to deal with much more battle-hardened competition.
U.S. retail was already incredibly sophisticated before the Internet came along — it was in this environment that sophisticated firms like Walmart, Costco and Best Buy incubated. E-commerce and the Internet certainly changed the game, allowing a new entrant like Amazon to join the fray, but these competitors have the scale, capital and capability to evolve their business models. And they have had plenty of time to do so — after two decades of unfettered growth, Amazon’s retail business is still a fraction of the size of Walmart’s and is around the same revenue as Costco. Even a smaller retailer like Best Buy sells roughly the same amount within the consumer electronics category.
The difference in competitive dynamic means that Alibaba should be able to command greater pricing power than Amazon. Amazon’s financials provide some evidence of this — in the past, it has “struggled” with GAAP profitability.
Some of this is undoubtedly because Amazon is re-investing massively back into growth. Amazon management also likes to note that the company’s obsessive customer focus means that they often choose to sacrifice near-term profitability so they can delight the customer by passing along the savings.
But I think this may also simply be because it has to compete with companies like Walmart that are also similarly obsessed with continuously optimizing its business model and lowering costs for its customers.
Conclusion #4 — Alibaba and Amazon are both re-investing in growth but go about it differently
Note in the last table the line item “Implied Overhead”. This figure represents product development or technology & content costs and allocated general & administrative overhead.
Amazon’s (at $8.1 billion) is significantly higher than Alibaba’s ($1.7 billion).
While some of this is likely a function of significantly lower staff and personnel costs in China vs. the U.S. it could also indicate that Amazon is re-investing significantly more technology resources back into growth. Indeed, from the very beginning the Amazon story has been all about re-investing all of its profits back into the business (or passing along lower prices to its customers) which has paid off handsomely in the emergence of businesses like Amazon Web Services — which incidentally appears to be a significantly more profitable business than e-commerce!
The main way that Amazon invests back into growth is by hiring developers and smart business people to pursue new business initiatives from within the Amazon umbrella. They also occasionally make a large acquisition like the recent deal for Whole Foods but this is rare. Hence the much higher fixed overhead compared to Alibaba.
Alibaba also takes a portion of its GAAP profits and re-deploys it into hiring new personnel to focus on new business areas. For example, it is pouring significant development resources into its fast-growing Alibaba Cloud business which is similar to AWS. It is also investing heavily into its digital media business to compete against Tencent and Baidu. Recently, Alibaba announced that it was going to expand its R&D budget by $15 billion over the next three years to focus on new areas such as artificial intelligence.
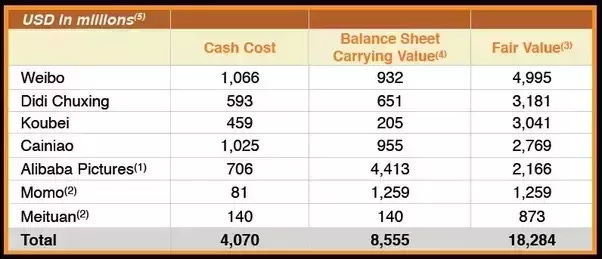
But Alibaba also re-invests earnings across dozens of startup companies in the Internet, e-Commerce, O2O (online-to-offline) and payments eco-systems in China and developing economies (right now a major focus is Southeast Asia). Alibaba has been quite a successful investor in large part because it comes from such an advantaged position — its proprietary transactional data is second-to-none — allowing it to play the role of “Kingmaker” as I described in another recent answer. This chart from the last Investor Day gives you an idea how well it has done re-investing its profits into its eco-system for the benefit of its stockholders:
Source: Alibaba 2017 Investor Day
Notes
[1] Operating income is essentially revenues minus operating expenses that are tied to generating the revenue. It is before taking into account interest income, interest expense, income taxes as well as non-operating income and expenses and some more esoteric accounting concepts like minority interest. I chose to define “profit margin” as operating income because:
It is a good measure of income that belongs to investors (equity and debt)
It is a standard metric generally available in the public filings
It can help smooth over differences in tax regime, capital structure and cost of debt financing across different operating jurisdictions
[2] EBITA stands for “earnings before interest, taxes and amortization”. The “adjusted” portion also excludes non-cash stock-based compensation (which can be volatile) and certain one-time expenses. I am using this figure because Alibaba reports Adjusted EBITA for its segment-level financials and also because it is quite similar to the “Adjusted Operating Income” reported at the segment level by Amazon. Source: Alibaba 20-F (2017)
[3] Gross Merchandise Value (GMV) does not account for product returns where the customer is refunded his money. Also, return rates can vary significantly by industry — and as clothing and apparel is one of Alibaba’s largest categories, this can cause a significant differences between GMV and actual fulfilled transactions. The “brushing” phenomenon which is relatively unique to Alibaba/China also creates variances. I explored this GMV question in a prior answer: Are Alibaba's numbers fake?
In any case, I have estimated (actually more like a guess) the variance between GMV and “true” Net Merchandise Value. The discount is going to be higher for Alibaba due to “brushing” and other factors discussed above and this is reflected in the chart. I think the estimate is directionally correct and fine for the purposes of this exercise.
This was originally published on Quora in December 2017.


