
Did China really use more cement in three years than the US in the entire 20th century?
It actually makes sense once you do a little math
A few years back, Bill Gates posted a stunning infographic that set the China-watching social media world ablaze for a brief period of time:

China has used almost 50% more cement in a mere three years than the world’s largest economy used in the entire 20th century. Sounds crazy, right? But I checked the original source and the numbers are indeed correct (I would not expect any less from something posted by Bill Gates).
However, when you dig into the numbers and then adjust for a few ways China is different from the United States, these numbers start to make a lot of sense and it starts to sound a lot less crazy.
It’s kind of like saying: “The average American household had a larger carbon footprint in two years (1972 and 1973) than the average Chinese person for the entire 20th century”. It’s absolutely true [1] and sounds kind of crazy but if you really break it down, it makes a lot of sense.

(1) The population difference
This one is easy. China’s population was 1.35 billion in 2012. The current population of the United States is around 326 million (0.33 billion), or a little over four times difference.
But remember we are comparing China in 2011–2013 with the United States from 1901 to 2000 — keep this distinction in mind as we calculate some of the other elements of the equation down below.
The average population of the United States in the 20th century was approximately 166 million. So this is really an 8.1x difference.
Said another way, adjusting for population means three years becomes 24 years (imagine splitting China up into roughly eight America-sized pieces; one of them would take 24 years to consume 6.6 gigatons of cement). Of course, this is still a huge difference compared to the century figure.
(2) Differences in construction materials
Residential construction is by far the largest use case for cement/concrete in the United States [2] accounting for around 75% of demand so that is where my focus is going to be. Looking at non-residential usage also matters, but it would also take a lot more time to compare and research.

In China, most residential dwellings are built primarily out of concrete. This is a housing development in Zhongshan, a Tier III city in China, built sometime in the last decade. I chose this picture because it shows how everything from the large apartment buildings to the smaller single-family “villas” are primarily built out of concrete:

Now let’s take a look at how a single-family home and large apartment building differ in terms of concrete use:

Even adjusting for differences in floor space (Americans have 2–3x the average living space vs. Chinese), large apartment buildings use more than double the concrete compared to a detached single-family home. For single-family homes, concrete is typically used in the foundation and basement only. For apartment buildings in China, concrete is used everywhere.
But not all Americans live in single-family homes and not all Chinese people live in concrete apartment buildings. Based on some high-level assumptions on type of housing stock (single-family vs. apartment), different living spaces I estimate that equivalent concrete consumption for the average Chinese person (rural and urban) should be around 50% more [3] than the average American — despite lower average living space.
This takes us another step closer to explaining the difference but we are still not all the way there.
(3) Difference in stage of development
For most of the 20th century, the investment component of GDP ranged between 10 to 20% of American GDP. Investment is relevant because it captures the economic activity (i.e. housing and infrastructure) that typically drives cement/concrete usage. It also captures non-residential demand which we skipped above.

Meanwhile in China, 2011 to 2013 was a particularly intense period of infrastructure and housing investment and this was reflected in the all-time high levels in the investment component of GDP (represented as “Gross Capital Formation” in the chart below).

As you can see the period from 2011–2013 in China was three times more intense — measured by investment % of GDP — as the United States in the 20th century. This is of course the big Chinese urbanization trend that most people have heard about — China is packing in a century’s worth of economic development into a four-decade period.
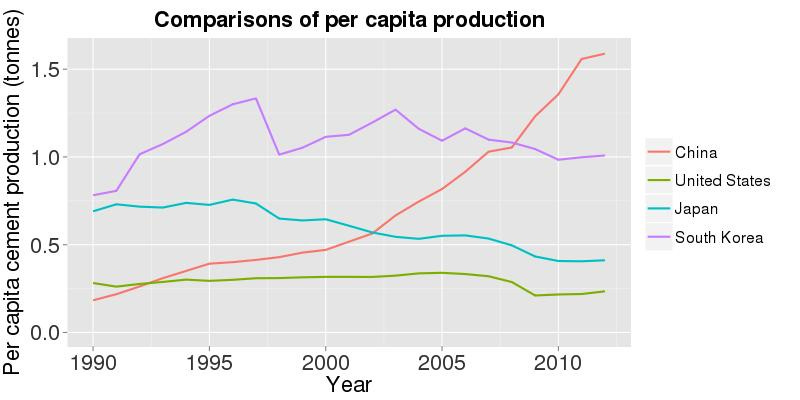
This level of intensity likely explains a lot of the remaining gap (although some still remains that I cannot explain — could certainly be from estimates being off). As China matures, its cement/concrete usage will peak and decline. For example, Japanese cement production peaked in the 1980s and South Korea’s peaked in the mid-1990s:
By now (late 2017), I expect that concrete demand/production has peaked or is close to peaking in China and will eventually decline as the economy moves on to a less investment and infrastructure-intensive stage of development.
To summarize:
China used around 45% more cement in a three years than the U.S. did in 100.
Adjusting for population (8.1x factor), it is more like 24 years worth.
Adjusting for differences in housing stock (~1.5x factor), it is now 37 years.
Adjusting for the the intensity of investment (another ~3x factor), it is now 110 years. Not all the way there but we are at least now in the same ballpark.
Please note that this analysis is based on high-level estimates which could be off (although not by an order-of-magnitude). Here are some ways you might further improve the analysis:
Cement-to-concrete ratio may be different in the U.S. vs. China. Bill Gates’ infographic measures cement while my analysis is based on concrete.
Tighten up estimates on concrete consumption in single-family vs. multi-family vs. large apartment buildings in the U.S. vs. China
Look at actual residential unit construction in China from 2011 to 2013 and compare it to the depreciable lives of residential construction in the U.S. over the course of the 20th century. This will give you a more accurate measure of the “intensity” of the 2011 to 2013 period for China than merely looking at investment as a percentage of GDP.
Analyze the non-residential sector — all of those highways, bridges and high-speed rail train tracks.
Compare concrete usage in other Asian countries like Japan and South Korea as well as Europe to see where China and the U.S. fall on the spectrum of concrete usage.
Notes
[1] Sources:
Index Mundi CO2 emissions: United States / China
Slate (CO2 emissions from the first half of the 20th century)
AEI (avg. U.S. household size in 1973 of 3.01)
[2] Statista: U.S. cement - residential consumption (2015: 32.45 million metric tons) vs. Statista: U.S. cement - non-residential consumption (2015: 11.23 million metric tons)
[3] Estimates for blended average concrete usage between the U.S. and China for residential housing stock:

This was originally published on Quora in December 2017.