charts & data | 2020.12.22
The capital efficiency of "docked" vs. "dockless" bike-sharing systems
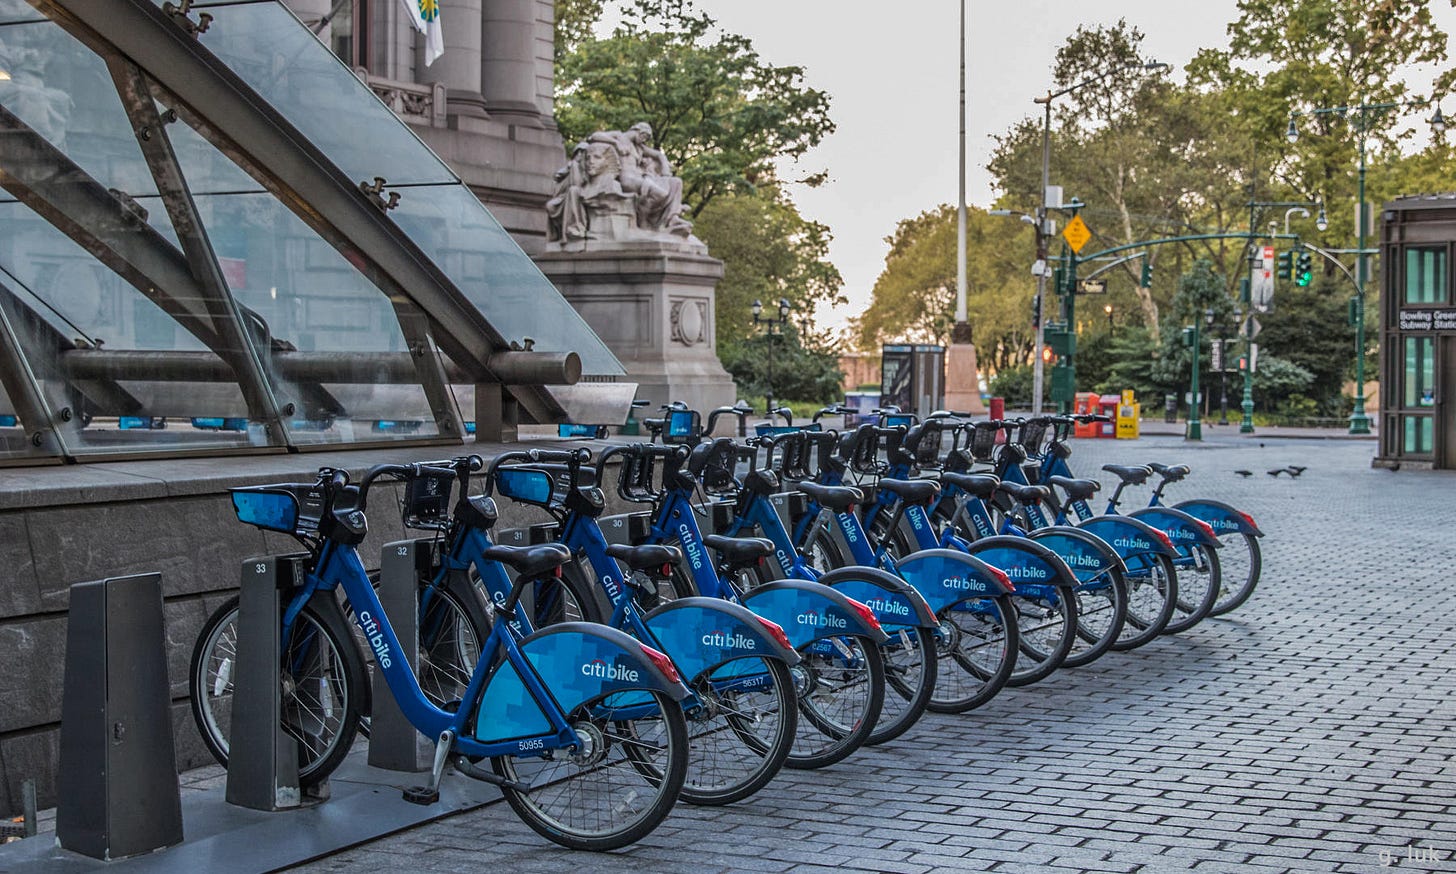
Last week in Taichung, I walked by a newly installed docking station where there was a marketing team promoting YouBike 2.0, the next-generation version of Taiwan’s bike-sharing program.
The biggest difference with YouBike 1.0 is that more of the intelligence is built into the bike vs. the docking station. In version 1.0, to unlock a bike, you would hold up your EasyCard to a sensor on the docking station — under 2.0, you hold it up to the sensor on the bike itself. It has also done away with a standalone kiosk for registering new users or taking payments, which can now be done within the mobile app.
In addition to unlocking the bike using a linked EasyCard, you can also unlock the bike with your phone using a QR code. Interestingly, this is closer to the approach used by “dockless” Chinese bike-sharing systems: the major difference being that you still need to dock the bike in Taiwan.
This got me thinking about the capital efficiency of various bike-sharing systems, and differences between the “docked” and “dockless” approach in various cities around the world.
For this edition of charts & data, I took a look at “docked” systems in three Tier I cities — New York, Paris and Taipei — and compared it to the “dockless” system in an illustrative Tier I Chinese city, Shenzhen. This is a follow-up to past articles I have written on the topic:
October 2020: Bike-sharing in China: Success or colossal waste?
December 2018: Is the dockless bike-sharing model a failure in China?
November 2017: What does the bike-sharing mania say about the Chinese economy?
Demographics
For the three docked systems, served population and areas were estimated based on the coverage of the docking stations:
New York: most of Manhattan and sections of Brooklyn, Queens, the Bronx and Jersey City.
Paris: all 20 arrondissements (city proper) plus portions of the outer municipalities
Taipei: 12 major sub-districts covered by YouBike’s station list
For Shenzhen, since there is no docking station requirement, I considered its entire urban area to be addressable.
System & Ridership
For the three docked systems, ridership data is provided by the monopoly operators in each city:
New York: Citibike provides detailed operating monthly reports. This data is as of August 2020. Ridership figures are for the twelve months ending February 2020 (i.e. the pre-pandemic peak).
Paris: Vélib’, a portmanteau of vélo (“bicycle”) and liberté (“freedom”), is the city’s bike-sharing operator. Source data compiled from here and here.
Taipei: YouBike provides updated ridership data for Taipei on its website.
Shenzhen’s data is derived from country-wide data for China, scaled proportionally by population:
There are approximately 19.5 million active shared bikes in China which provide over 12 billion rides per year.
China’s addressable market is the entire urban population, totaling around 842 million people.
In the aftermath of the pandemic, shared-bike usage has increased both in frequency and average trip length, which doubled from “1.4 to 1.7 km” to “3.0 to 3.7 km” by July 2020.
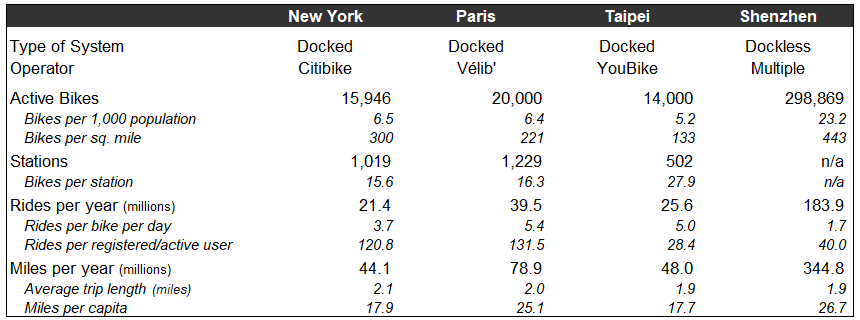
One thing we notice here is that the concentration of shared bicycles is much higher under the “dockless” model compared to “docked”. This makes sense as capital does not need to be spent building stations can be used to purchase more bicycles.
“Docked” systems in New York and Paris are similar in terms of station construction, averaging between 15-17 (active) bikes per station. YouBike stations in Taipei are noticeably larger, at around 27 (active) bikes per station. I have noticed that the YouBike stations in Taipei tend to be quite far apart, distance-wise.
Under the “dockless” model, individual bikes are generally used far less often, because there are so many of them. In China, the average shared bike is used only 1.7x per day.
There is also a difference in the number of rides per active/registered user. In New York and Paris, active users use the system over 100 times per year. In Taipei and China, registered users use the system between 30-40 time per year. I suspect that this may be due to differences in the definition of an “active” or “registered” user.
In Taipei and China, it is very easy — and costless — to start using the system. In Taipei, you just register your EasyCard (the RFID metro card that everyone has in their wallet or on their phone) for YouBike. In China, you may register on your phone by downloading the app or using it through one of the super apps like Alipay.
In contrast, Citibike and Vélib’ offer annual paid “all-you-can-eat” type membership plans. So while only 7-9% of the served population will be considered active/registered users in New York and Paris, Taipei and Shenzhen might count one-third of the population as active/registered users.
The friction costs for joining the system in China or Taiwan are lower than in Paris and New York.
What ultimately matters is system utilization. On a per capita basis, Paris and China see the greatest usage. The average person rides about 25-27 miles per year. In New York and Taipei, the average person rides about 17-18 miles per year.
Investment & Financials
Financial data is a bit patchy but I was able to pull together rough numbers from various sources.
New York / Citibike:
Citi paid $111 million in two phases to help get Citi Bike launched, in return for naming rights through 2024. In 2018, Lyft announced a $100 million investment over five years to expand the system. There may have also been some additional funding in the system for operating losses in the initial startup period but I have not included it.
Citibike discloses monthly revenue in its operating reports. The $52.9 million figure is for the twelve months ending August 2020 and includes sponsorship revenue.
Paris / Vélib’:
The world’s first large-scale bike-share program was funded by advertiser JCDecaux for $140 million in July 2007, building out over two phases a system featuring 16,000 shared bikes and 1,200 stations. This nets out to approximately $8,750 per active bike.
Vélib’ does not disclose its financials but by comparing its tariff scheme to Citibike’s, I estimate the average revenue per ride is about $1.00, or about 40% of Citibike in New York.
Taiwan / YouBike:
YouBike was the brainchild of the CEO of Giant Bicycle Corporation, the world’s largest bicycle company. It was built as a build-operate-transfer (BOT) project and began full operations in 2012.
While financials are not disclosed, the initial pilot scheme comprised of 500 bikes cost NT62.5 million (approximately $2.1 million), which works out to $4,167 per bike. Applied to the current ~14,000 bike system in Taipei, this yields an estimated $58 million roll-out cost.
YouBike’s tariff scheme is very simple, a pay-as-you-go plan starting at NT10 ($0.36) for the first 30 minutes.
Shenzhen:
I estimate that ~$8 billion of equity investment was poured into launching dockless bike-sharing across China — with the big three of Hellobike, Mobike (now part of Meituan) and Ofo (largely defunct) taking in ~$5 billion altogether.
This includes funding for the dozens of bike-sharing companies that no longer exist, and accounts for tens of millions of bicycles that were eventually scrapped as the industry went through the initial boom-bust phases before reaching equilibrium.
With 19.5 million currently active bikes, this works out to $410 in funding per bike. Based on Shenzhen’s proportion of China’s urban population, this works out to approximately $123 million in funding for the city.
Tariffs for dockless bike-sharing are simple, with a 30-minute ride costing ¥1.00 ($0.15) in Tier I cities like Shenzhen.
The number that stands out is the amount of funding per actively deployed bike. “Dockless” systems are one or even two orders of magnitude less expensive because the vast majority of the cost is for building out the docking stations. Remember that it is not enough to build a single docking station for every deployed bike — you need to have empty spots available to handle incoming traffic. The ratio for YouBike in Taiwan is around 2 docks for every active bike.
For example, in the YouBike pilot scheme, over 90% of the $4,167 cost per active bike went to building the docking stations — the bicycles themselves only cost around $333 each.
Deployment costs for the “docked” systems in New York and Paris were also more expensive than Taipei due to differences in local construction costs.
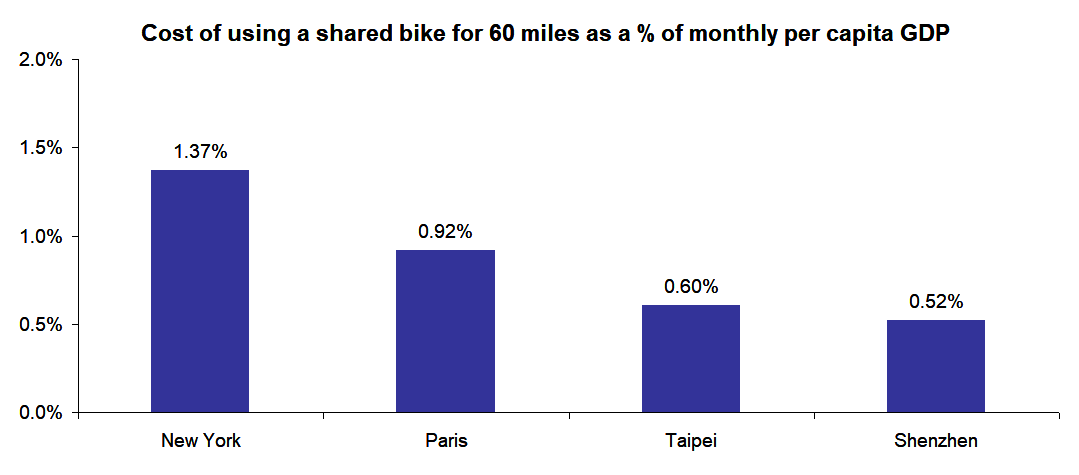
Higher upfront costs translate into differences in relative affordability. The relative cost of shared bikes is highest in New York and lowest in Shenzhen. This calculation adjusts for differences in disposable income between the different cities.
Positive Externalities
Besides the economic value represented by the tariffs paid by users, there are also tangible environmental and health benefits from shared bike systems.
Citibike estimates that each mile on a shared bike offsets around 0.52 lbs of CO2 emissions. This is because using a bike often offsets the use of a more energy-intensive option like taking a taxi. Other bikeshare systems estimate even higher savings but we will use this figure for our assumptions.
The EPA estimates that an average gasoline-powered automobile creates about 4.6 metric tons of CO2 every year. So one way to think about it is that bike-sharing takes the equivalent of 17,682 vehicles worth of CO2 emissions of the streets for the city of Shenzhen.
We can put a dollar value on these offset carbon emissions. Some reports value the social cost of CO2 emissions at $77 per metric tonne, while carbon credits can be priced anywhere from $3 to 130 per tonne. For the purposes of this analysis, I am using a constant $50 per ton for all four cities.
Similarly, Citibike estimates that each mile on a shared bike is the equivalent of burning 40 calories. At 3,500 calories per lb., we can calculate the potential weight loss by encouraging the use of non-powered shared bikes.
We can also put a dollar value on the weight loss. Using $1.5 billion that Weight Watchers generates in annual revenue from 4.6 million subscribers as a proxy, I estimate that consumers are willing to pay the company around $6 per lb. in weight loss. I use this figure for New York and correspondingly lower figures (adjusted for per capita GDP) for the other cities to calculate the societal gain from weight loss and health benefits.
The key finding here is that although the economic returns are a bit lower for Shenzhen due to its significantly lower tariff prices, because bike-sharing is (i) so prevalent, and (ii) so affordable, higher shared-bike use yields greater benefits from positive externalities like health/weight loss and environmental benefits.
The other interesting finding was Taipei ranking lower in terms of total return. This could be due to incomplete data, but it may also suggest that Taipei should increase the density of bike stations to make it more convenient and drive higher usage. I know I would use it much more if I did not have to deal with the friction costs of planning out the trip based on availability of open docks at docking stations.
The Bottom Line
I am partial to the “dockless” approach. It has clear advantages — lower cost of deployment, greater coverage area and accessibility — and its disadvantages (e.g. congested sidewalks, vandalism) can be mitigated as has been seen in China after the initial trial-and-error period.
The reality is that shared bicycles are likely an intermediate stage in the evolution of urban transportation. Many cities with bike-sharing systems have rolled out (or are considering rolling out) electric-powered bicycles and scooters, all of which are de facto “dockless” systems, using the methods pioneered by the original “dockless” bike-sharing companies in China even as many of them have faded away into history.


